


Volume 12, Issue 4 (2024)
Health Educ Health Promot 2024, 12(4): 649-660 |
Back to browse issues page


Download citation:
BibTeX | RIS | EndNote | Medlars | ProCite | Reference Manager | RefWorks
Send citation to:


BibTeX | RIS | EndNote | Medlars | ProCite | Reference Manager | RefWorks
Send citation to:
Ayaad O, Ibrahim R, AlBaimani K, AlGhaithi M, Sawaya Z, AlHasni N, et al . Predicting and Classifying the Perceptions of Learning Needs Importance in Cancer Patients; a Machine Learning Approach. Health Educ Health Promot 2024; 12 (4) :649-660
URL: http://hehp.modares.ac.ir/article-5-77715-en.html
URL: http://hehp.modares.ac.ir/article-5-77715-en.html
O. Ayaad *1, R. Ibrahim1, Kh. AlBaimani2, M.M. AlGhaithi1, Z.G. Sawaya3, N.S. AlHasni3, H.S. AlAwaisi3, A.S. AlFahdi4, B. Al Faliti1, B.M. Salman5
1- Quality and Accreditation Department, Sultan Qaboos Comprehensive Cancer Care and Research Centre (SQCCCRC), University Medical City, Muscat, Oman
2- Sultan Qaboos Comprehensive Cancer Care and Research Centre (SQCCCRC), Muscat, Oman
3- Nursing Department, Sultan Qaboos Comprehensive Cancer Care and Research Centre (SQCCCRC), University Medical City, Muscat, Oman
4- Holistic Care Department, Sultan Qaboos Comprehensive Cancer Care and Research Centre (SQCCCRC), University Medical City, Muscat, Oman
5- Pharmacy Department, National Hematology and Bone Marrow Transplant Center, University Medical City, Muscat, Oman
Keywords: Artificial Intelligence [MeSH], Machine Learning [MeSH], Neoplasms [MeSH], Chemotherapy [MeSH], Health Literacy [MeSH]
Full-Text [PDF 1121 kb]
(1983 Downloads)
| Abstract (HTML) (897 Views)
Full-Text: (101 Views)
Introduction
Machine learning (ML) and artificial intelligence (AI) are at the forefront of technological advancements in healthcare, playing pivotal roles in predicting learning needs and evaluating their perceived importance [1, 2]. These technologies leverage the power of data to create predictive models that highlight gaps in knowledge and skills, thereby empowering educators and healthcare managers to develop more effective, patient-centered learning programs. By analyzing large and complex datasets, ML algorithms can identify trends and insights that would otherwise remain hidden, helping healthcare providers and patients address specific deficiencies in knowledge and skill development [1, 2].
One of the key advantages of ML models is their ability to monitor training outcomes in real time. Unlike traditional methods of education evaluation, which may rely on periodic assessments, ML enables continuous adaptation of learning programs. For instance, when healthcare staff or patients demonstrate improvement in certain areas but show deficits in others, ML can dynamically adjust the educational content to target these emerging gaps [3]. Innovations such as federated learning have further enhanced this capability by allowing collaboration across multiple organizations while maintaining stringent data privacy standards. This ensures that learning needs are identified and prioritized on a larger scale without compromising sensitive information [3, 4].
The application of ML and AI extends beyond the simple identification of knowledge gaps. These tools are now being used to assess and integrate the perceived importance of these learning needs, a factor that significantly influences engagement, satisfaction, and the overall effectiveness of educational interventions. For example, understanding how patients and healthcare providers prioritize different aspects of education allows for a more targeted approach to designing programs that resonate with their expectations and goals [4, 5]. This ensures that the educational resources are not only comprehensive but also aligned with the specific needs and preferences of the audience [5].
AI has been particularly transformative in the context of chronic disease management, including cancer care, where it helps predict learning needs and their perceived importance. For example, in the management of diabetes and hypertension, ML algorithms have been successfully used to identify gaps in clinical knowledge and skills among healthcare providers, guiding the development of focused training programs [6]. Similarly, in oncology, AI tools predict learning needs related to disease progression, treatment side effects, and psychological support, while simultaneously assessing how patients prioritize these areas of education. This dual focus ensures that educational interventions are tailored not only to address objective knowledge gaps but also to align with patients’ perspectives and priorities [6, 7].
Cancer patients often face complex and multifaceted challenges that necessitate tailored education to navigate their diagnosis, treatment options, and self-management strategies. The perception of these learning needs (how important patients consider specific topics) plays a critical role in determining their engagement with educational programs. For instance, patients who perceive their learning needs as unmet may experience anxiety, frustration, or disengagement, negatively impacting their adherence to treatment plans and overall health outcomes. Conversely, addressing learning needs that patients deem important fosters a sense of empowerment, improves their quality of life, and enhances their satisfaction with care [8, 9].
AI and ML models are invaluable in assessing the perceived importance of learning needs. By analyzing diverse sources such as patient feedback, demographic data, and behavioral patterns, these tools can identify trends in how patients prioritize educational topics. For instance, individuals with low literacy levels may value simplified resources that explain treatment protocols in layman’s terms, while those with higher literacy levels may seek detailed information about advanced therapies or clinical trials [10, 11]. This segmentation enables healthcare providers to create personalized educational materials that not only fill knowledge gaps but also resonate with the preferences and expectations of individual patients.
The integration of AI-driven insights allows healthcare providers to address not only the cognitive aspects of learning but also the emotional and psychological dimensions. For example, patients undergoing chemotherapy may prioritize learning about managing side effects, while others may find psychological support and coping mechanisms more critical. AI tools can assess these preferences and provide tailored resources that enhance patients’ trust in their care teams and facilitate active participation in their treatment plans. This approach ensures that education is holistic, addressing the physical, emotional, and informational needs of patients [12, 13].
AI technologies are increasingly being applied to identify and address learning needs in cancer care. For instance, ML algorithms analyze patient-reported outcomes and satisfaction surveys to detect gaps in education related to treatment protocols, genetic testing, and symptom management. These tools predict the importance patients assign to specific learning topics, enabling the development of targeted educational resources that cater to both objective needs and subjective priorities [14, 15].
In addition, AI’s role in cancer education extends to analyzing intervention outcomes in mental healthcare. Similar methodologies can be applied in oncology to assess patients’ priorities and provide tailored resources that enhance their understanding of disease management and self-care [16, 17]. Predictive models generated by AI not only personalize the learning experience but also ensure that it evolves with the patient’s changing needs and preferences, creating a dynamic and responsive educational framework [14, 15].
Innovative approaches, such as federated learning, enhance these applications by facilitating collaboration among healthcare institutions while preserving patient privacy. This enables the pooling of diverse data sources, leading to a more comprehensive understanding of collective learning needs and educational priorities across different populations [3, 18].
The perception of learning needs and their importance directly influences patient satisfaction, engagement, and health outcomes [19]. Patients who feel that their educational needs are prioritized are more likely to engage actively in their care, adhere to treatment protocols, and achieve better health outcomes. By leveraging AI to understand these perceptions, healthcare providers can design interventions that address not only knowledge gaps but also the emotional and psychological priorities of patients. This alignment fosters trust, empowers patients, and ultimately improves the overall quality of care [19, 20].
This study explores the application of AI and ML models in predicting and addressing the perceived importance of learning needs from the patient’s perspective, with a focus on oncology. By integrating advanced predictive technologies with patient-centered education strategies, this research demonstrates the potential of AI to transform cancer care. Through a combination of objective data analysis and subjective prioritization, AI ensures that educational interventions are relevant, effective, and aligned with the unique needs of patients.
Instruments and Methods
This study employed a machine learning approach to predict and classify perceptions of the importance of learning needs. The methods consisted of data collection, preprocessing, exploratory data analysis, feature engineering, model training, and evaluation. The focus was on utilizing machine learning models to predict and classify learning needs based on various features, including demographic data, health literacy scores, and experience metrics.
Setting and design
The study was conducted at the Sultan Qaboos Comprehensive Cancer Center, University Medical City, located in Muscat, Oman in 2024. A cross-sectional design was conducted to assess health literacy and learning needs among cancer patients.
Sampling
The population for this study consisted of cancer patients who were receiving treatment at the Sultan Qaboos Comprehensive Cancer Center (SQCCCRC) in Muscat, Oman. Participants of the study needed to meet the following inclusion criteria:
- Diagnosed with cancer
- Receiving treatment at the SQCCCRC
- Willingness to participate and able to complete the survey online
A convenience sampling approach was employed to select participants for the study to recruit a representative sample size of 218 patients. This sample size was selected based on a 95% confidence level and a 5% margin of error.
Instrument
To comprehensively capture the study’s objectives, a self-reported questionnaire was employed, comprising the following sections:
- Demographic information: Included age, gender, region, job status, marital status, diagnosis, diagnosis date, and current treatment.
- Health literacy assessment: The health literacy instrument for adults (HELIA), which consists of 33 items assessing reading, access to information, understanding, appraisal, and decision-making, was used. It ranks health literacy from 0 (inadequate) to 100 (excellent) [17].
- Needs assessment questionnaire: This survey covered psychosocial, informational, physical, patient care, and communication domains. Participants rated each domain's importance on a 5-point Likert scale. Items were derived from Chua et al. [18].
The questionnaire showed a Cronbach's alpha score of 0.84, indicating high internal consistency. Content validity was established by consulting a panel of five experts in public health and health literacy. The experts reviewed the items to ensure they adequately addressed domains such as access to information, comprehension, appraisal, and numeracy. Face validity was tested by piloting the questionnaire with a sample of 20 participants from the target population. Participants reported that the questions were clear, relevant, and easy to understand, confirming the tool’s appropriateness for the intended audience.
Data collection
After obtaining approval from the Institutional Review Board (IRB) at the Sultan Qaboos Comprehensive Cancer Center (SQCCRC), potential participants were recruited face-to-face by the research team using an information statement. If the patient agreed to participate, an invitation letter with the information statement was sent through WhatsApp. Participants who agreed to participate completed and submitted the self-administered questionnaire.
Data preprocessing
The collected data underwent extensive preprocessing to prepare it for model training. The preprocessing steps included data cleaning, normalization, feature encoding, and data splitting:
- Data cleaning: Mean imputation was used for numerical characteristics and mode imputation was used for categorical data in order to handle missing values. Interquartile range (IQR) analysis was used to identify outliers, which were then either eliminated or adjusted to guarantee data quality.
- Normalization: In order to make sure that all numerical features were scaled to have comparable ranges (a crucial step for distance-based models) normalization was applied.
- Feature encoding: To prepare them for machine learning models, categorical variables (like gender and educational attainment) were encoded using one-hot encoding. In order to maintain their inherent order, ordinal features (like health literacy levels) were also converted into numerical values.
- Data splitting: Following preprocessing, an 80-20 split ratio was utilized to assign the dataset into training and testing sets. This division made sure that 80% of the data was utilized for training the models and 20% was set aside for testing the models' performance on data that had not yet been seen.
Exploratory Data Analysis (EDA)
Prior to model training, an exploratory analysis was utilized out to learn the collected data. Visualizing feature distributions, analyzing parameter correlations, and spotting patterns in the dataset were all part of EDA. Understanding the distribution of learning needs across various demographic groups and identifying substantial relationships between health literacy scores and the relevance of learning needs were among the key results.
Feature engineering
To increase the models' capacity for prediction, feature engineering was done. As part of this process, new features were created from the ones that already existed. For example, aggregated health literacy scores and interaction terms between various features (such as those between demographic characteristics and experience metrics) were calculated. The most significant characteristics that contributed to the target parameter were found using feature selection approaches, such as mutual information analysis and recursive feature elimination (RFE), which decreased dimensionality and enhanced model performance.
Prediction models
Three machine learning models (Gradient Boosting Regressor, Random Forest Regressor, and Linear Regression) were used to make predictions. The models were selected because they each used a different approach to identifying patterns in the data.
- Linear Regression: Because of its ease of interpretability and use, it served as the baseline model. It is a useful model for preliminary analysis since it presumes a linear relationship between the features and the target variable.
- Random Forest Regressor: Because of its capacity to manage non-linearity and feature interactions, Random Forest, an ensemble model, was selected. It is composed of several decision trees, and by averaging them, overfitting is decreased, improving performance.
- Gradient Boosting Regressor: By gradually constructing an ensemble of weak learners and optimizing for decreased error in each iteration, Gradient Boosting was utilized to improve prediction accuracy. This approach is renowned for its capacity to identify intricate connections within the data.
Grid search cross-validation was used for hyperparameter tuning, which optimized each model's parameters, including the maximum decision tree depth and the number of estimators. To reduce the chance of overfitting, model performance was evaluated during tuning using five-fold cross-validation.
The models were evaluated based on multiple metrics to provide a comprehensive assessment of their performance:
- Mean Absolute Error (MAE): Without taking direction into account, MAE was utilized to calculate the average magnitude of the forecast errors. Better model performance was indicated by lower MAE values.
The standard deviation of the prediction errors was measured using the Root Mean Squared Error (RMSE). RMSE is a helpful indicator for identifying notable deviations since it assigns a higher weight to larger errors.
- R2 Score: This metric was used to calculate the percentage of the target parameter’s variance that the model could account for. A greater percentage of the variance might be explained by the model, according to a higher R2 Score.
To determine which features had the greatest influence on the prediction, feature importance analysis was also carried out for every model. Finding the features in the dataset that had the most effects on the target parameter was made easier by the importance scores for features like Total Learning Need Assessment, Total Surgery, and Health Literacy Total Score. Furthermore, to evaluate model performance qualitatively, visualizations of the actual versus anticipated values were made. Scatter plots were used to illustrate how closely the predicted and actual values matched.
Classification models
Learning needs were categorized using four models: Random Forest, Gradient Boosting, Decision Tree, and Extra Trees, in addition to regression analysis. Using categorical goal parameters to provide varying degrees of relevance to learning demands, the models were trained on the same dataset.
- Random Forest: This ensemble model was chosen due to its resilience to overfitting and capacity to manage a large number of features. It improved generality by averaging several decision trees.
- Gradient Boosting: This technique was selected due to its ability to capture intricate feature relationships and handle unbalanced datasets. It constructs trees one after the other, each one attempting to fix the mistakes of the one before it.
- Decision Tree: Because of its interpretability and capacity to manage both numerical and categorical variables, a decision tree was employed. It shed light on the model's decision-making procedure.
- Extra Trees: Using random splits for node splitting, Extra Trees, a Random Forest variant, was used to lower variance and enhance generalization.
Four important measures were used to assess the classification models' performance: Accuracy, precision, recall, and F1-score. To provide further light on each model's classification performance and misclassification trends, confusion matrices were created. The confusion matrices showed the distribution of mistakes across classes, and these metrics assisted in evaluating how effectively each model matched sensitivity and specificity. ROC curve study for several classifiers, such as Random Forest, Gradient Boosting, Decision Tree, and Extra Trees, shows how well they predict the "Classification of Importance". The Area Under the Curve (AUC) score, which shows how effectively the model can differentiate between "Very High Importance" and other classes, is used to evaluate each classifier's performance.
Findings
Demographics and parameters information
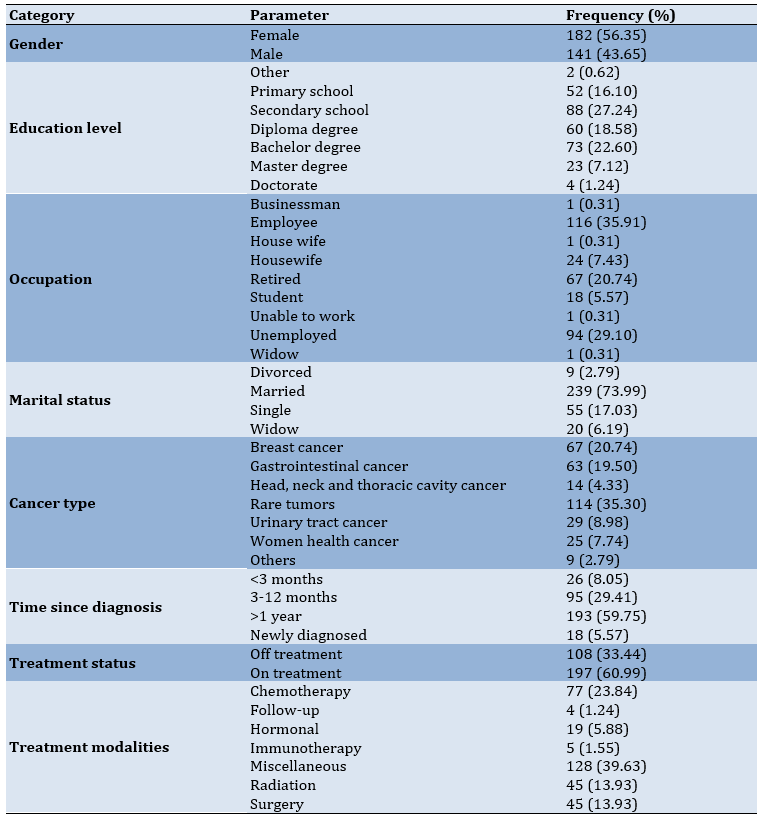
According to the demographics and clinic characteristics of the patients, the age of participants ranged from 19 to 86 years, while the average was 45.81 years with a standard deviation of 15.55 years. In the gender category, 182 patients (56.35%) were female. The largest group consisted of patients with a secondary school education (n=88, 27.24%). The majority of patients were employed (116, 35.91%) and married (239, 73.99%). In terms of clinical characteristics, most patients were diagnosed with rare tumors (n=107, 33.13%) including sarcoma. Regarding time since diagnosis, most patients had been diagnosed for over a year (n=193, 59.75%) and on treatment (n=197, 60.99%). Lastly, miscellaneous treatments were the most common treatment modalities (n=128, 39.63%; Table 1).
Table 1. Demographics and clinic characteristics
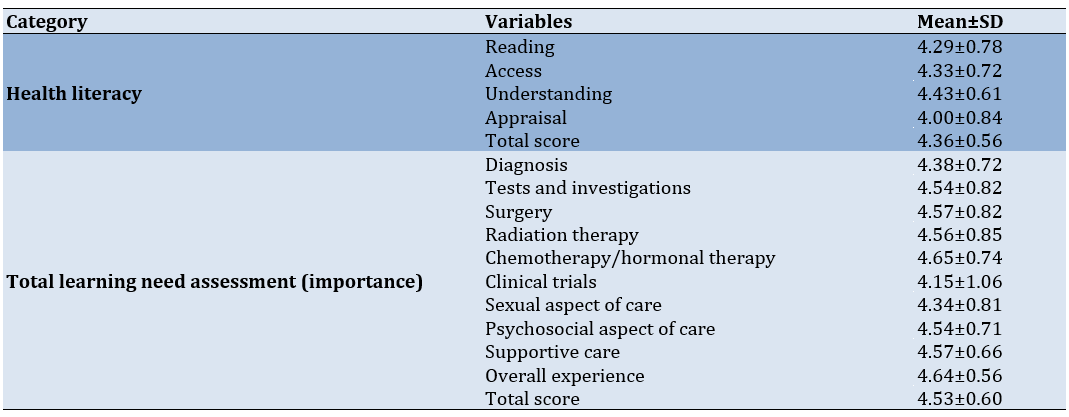
The highest mean score was for "understanding" domains (mean±SD=4.43±0.61), meaning that patients generally found this area to be the most developed. The lowest score was for "appraisal" (mean±SD=4.00±0.84). The average total score for health literacy was 4.36±0.56, indicating a high level of health literacy among patients. For learning need assessment (importance), the "chemotherapy/hormonal therapy" domain had the highest importance score (mean±SD=4.65±0.74). The "clinical trials" domain had the lowest importance (mean±SD=4.15±1.06). The total score for the learning need assessment was 4.53±0.60, showing a high perception of learning needs importance in most areas (Table 2).
Table 2. Health literacy, learning need assessment importance, satisfaction with education activities
Prediction models
In order to assess the performance, metrics for three regression models of Linear Regression, Random Forest Regressor, and Gradient Boosting Regressor were evaluated using Mean Absolute Error (MAE), Root Mean Squared Error (RMSE), and R2 Score (Figure 1).
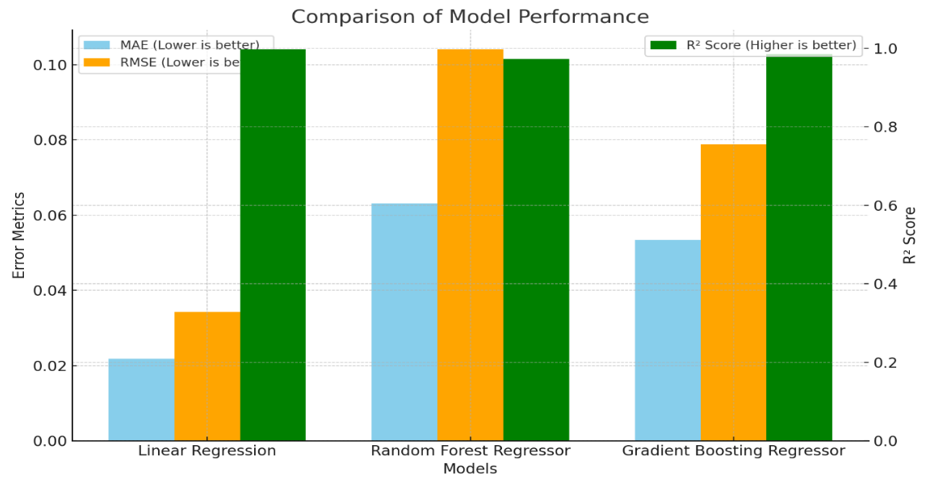
Figure 1. Comparison of model performance
Linear regression performed the best in terms of MAE and RMSE, with values of 0.0218 and 0.0343, respectively. This indicates that the average and squared deviations of the predicted values from the actual values were the lowest for this model, meaning it had the smallest error among the three models. Additionally, the R2 Score of 0.997 indicates that the Linear Regression model explained 99.7% of the variance in the target parameter, making it the most effective in fitting the data.
Random Forest Regressor had an MAE of 0.0631 and RMSE of 0.1041, which were higher than those of Linear Regression. This implies that the model made slightly larger errors in predicting the target variable. The R2 Score of 0.9727 indicates that it explained 97.27% of the variance, which is still quite good but slightly lower compared to Linear Regression and Gradient Boosting.
Gradient Boosting Regressor achieved MAE and RMSE values of 0.0534 and 0.0788, respectively, which were better than those of Random Forest but not as low as Linear Regression. The R2 Score of 0.9844 suggests that it explained 98.44% of the variance, placing it between Linear Regression and Random Forest in terms of model fit. Overall, Linear Regression demonstrated the lowest error rates and the highest ability to explain the variance in the data, making it the best performer among the three models based on these metrics. Gradient Boosting also performed well, especially in minimizing errors and explaining variance, while Random Forest showed slightly higher error rates but still provided a solid performance.
Feature importances
The visualization depicts the feature importance scores for three different machine learning models to indicate the level of feature that contribution to the model’s predictions, helping us understand which factors play the most significant roles in learning needs importance (Figure 2).
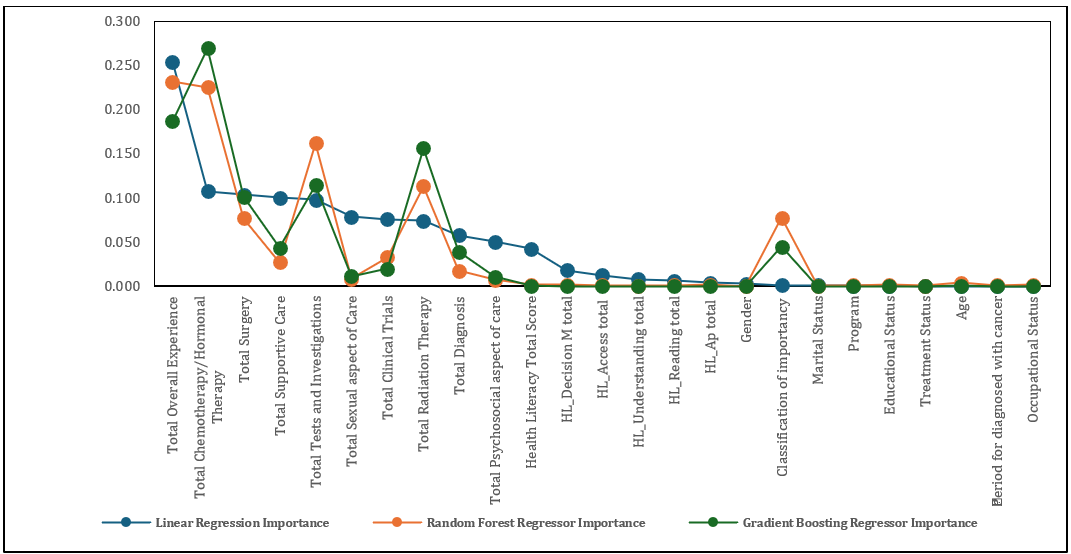
Figure 2. Feature importance scores for three different machine learning models: Linear Regression, Random Forest Regressor, and Gradient Boosting Regressor
From the chart, total chemotherapy/hormonal therapy and total overall experience emerged as the most influential features across all models, although the degree of importance varied by model. These features were particularly significant in Gradient Boosting and Random Forest, which assign higher importance to them compared to other features. These findings suggested that the patient's overall experience and specific treatments such as chemotherapy or hormonal therapy were critical in understanding and predicting learning needs.
Total tests and investigations and total radiation therapy also showed considerable importance, especially in Random Forest and Gradient Boosting. These features contributed substantially to the predictive capabilities of the models, likely reflecting the critical role of diagnostic and therapeutic interventions in shaping patients' perceptions of learning needs.
In contrast, features related to health literacy and some demographic characteristics, such as gender and educational status, generally had lower importance scores across all models. This indicates that while these factors might still contribute to the model’s understanding, they had less direct impact on learning needs compared to treatment-related experiences and overall patient care.
Overall, the analysis highlighted the importance of focusing on patients' treatment experiences and specific medical interventions when predicting and classifying learning needs. Gradient Boosting appeared to prioritize fewer but more influential features, while Random Forest distributed the importance more evenly, reflecting each model’s distinct approach to learning from the data. This insight can be useful for tailoring interventions or communication strategies based on the aspects that most significantly influence patient perceptions.
Actual vs predicted values for different models
Compares the actual values with the predicted values from three different machine learning models, all three models generally followed the trend of the actual values, which suggests that they were effectively capturing the underlying patterns in the data. However, there were noticeable differences in how closely each model's predictions match the actual values.
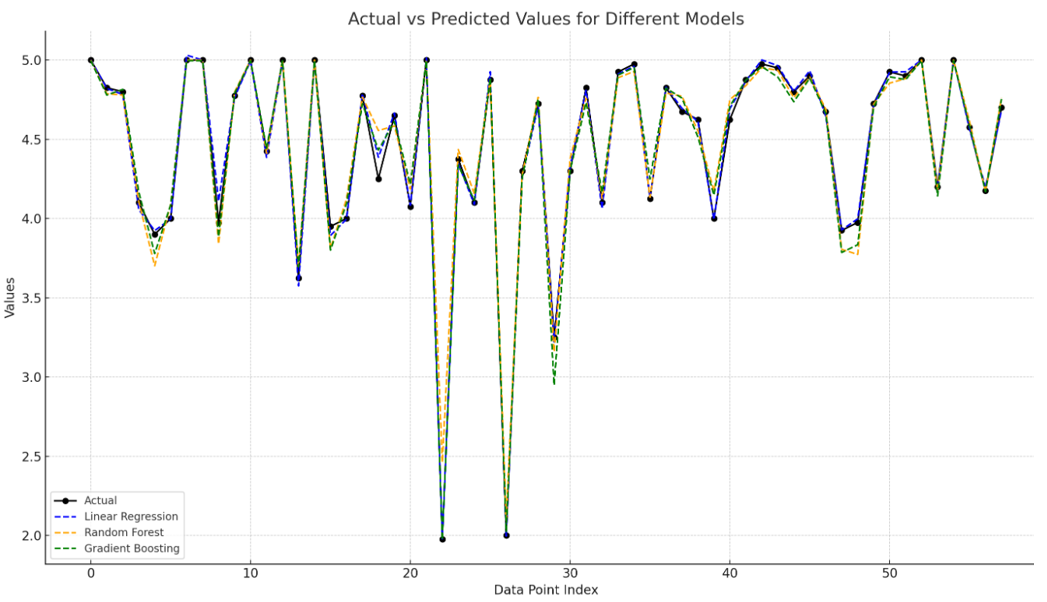
Figure 3. The actual values with the predicted values from three different machine learning models: Linear Regression, Random Forest, and Gradient Boosting
The predictions from the Linear Regression model are represented by the dashed blue line. It closely follows the actual values in most areas but tends to have slightly larger deviations in complex regions of the data. This behavior indicated that Linear Regression, being a simpler model that assumes a linear relationship, struggles to handle non-linear complexities.
The orange dashed line represents the predictions from the Random Forest model. It performed well in capturing variations, often staying closer to the actual values compared to Linear Regression. However, some deviations were present, particularly in areas where the data exhibited more variability. Random Forest, as an ensemble of decision trees, was better suited for capturing non-linear relationships but still faced challenges in certain regions.
The green dashed line showed the predictions from the Gradient Boosting model. It consistently followed the trend of the actual values more closely compared to both Linear Regression and Random Forest. Gradient Boosting built an ensemble of weak learners sequentially, allowing it to correct errors iteratively, which explains why it often captures intricate details more effectively and provides more accurate predictions.
Overall, Gradient Boosting appeared to provide the most accurate predictions, as indicated by its closer alignment with the actual values throughout the dataset. Random Forest also demonstrated good performance, though with more fluctuations, while Linear Regression tended to show larger deviations, especially in complex areas. This visualization highlights the strength of ensemble models like Gradient Boosting and Random Forest in capturing the nuances in the data, making them better suited for this task compared to Linear Regression.
Classification models
The performance metrics for four classification models: Gradient Boosting, Decision Tree, Random Forest, and Extra Trees was assessed using four key metrics of precision, recall, accuracy, and F1-score. The bar chart visualization compares the performance metrics (accuracy, precision, recall, and F1-score) for four different machine learning classification models.
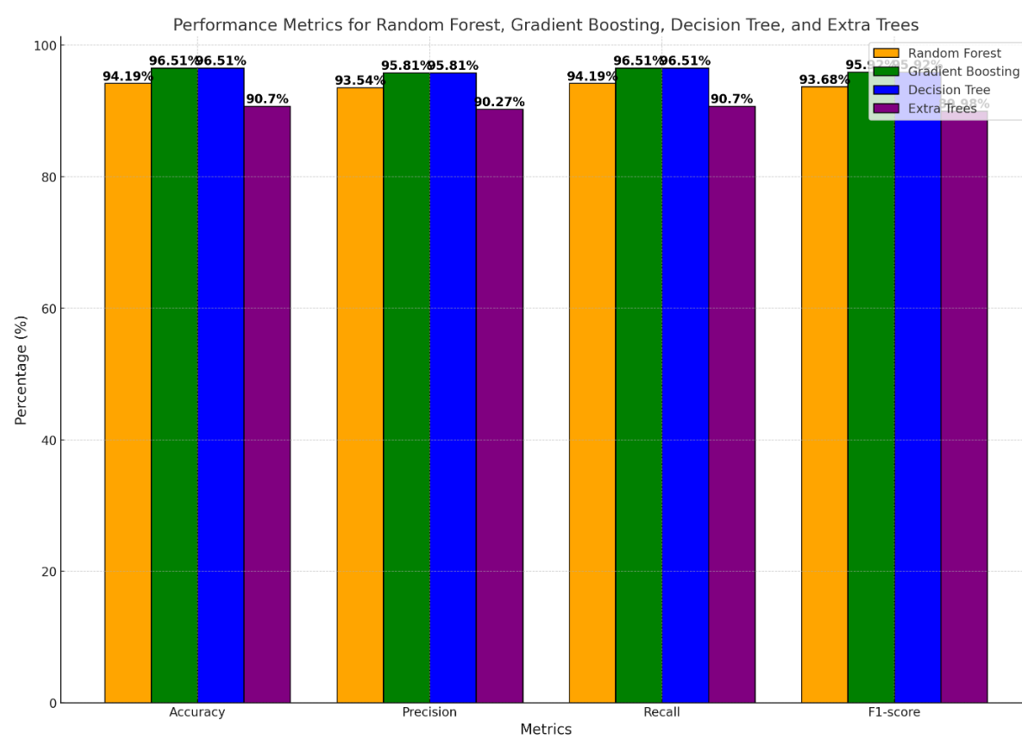
Figure 4. Performance metrics for four classification models (Random Forest, Gradient Boosting, Decision Tree, and Extra Trees) across four key metrics: Accuracy, precision, recall, and F1-score
Gradient Boosting and Decision Tree models demonstrated the highest performance across all metrics, each achieving 96.51% for accuracy, precision, recall, and F1-score. This indicates that both models were highly effective in correctly classifying instances and balancing between minimizing false positives and false negatives. They both exceled in providing consistent, reliable predictions and appear well-suited to the dataset’s complexity.
The Random Forest model also performed well but had slightly lower values compared to Gradient Boosting and Decision Tree. Specifically, it achieved an accuracy of 94.19% and similar values for the other metrics. Although its performance was strong, it lagged behind the top two models. This could be due to the way Random Forest averages multiple decision trees, which might have led to slightly less sensitivity in capturing complex interactions in the data.
Extra Trees showed the lowest performance among the four models, with accuracy, precision, recall, and F1-score values around 90.70% (Figure 4). While it still provides reliable predictions, its performance was not on par with the other models. This could be due to its use of random splits during training, which adds more variance and may reduce precision in handling certain types of data patterns.
The results showed that Gradient Boosting and Decision Tree were the most effective models for classifying the learning needs importance, providing equally high values across all performance metrics. These models successfully identified important patterns in the data, minimizing both false positives and false negatives. Random Forest also exhibited good predictive capabilities, though with a slight reduction in overall accuracy compared to the top models.
Confusion matrix analysis
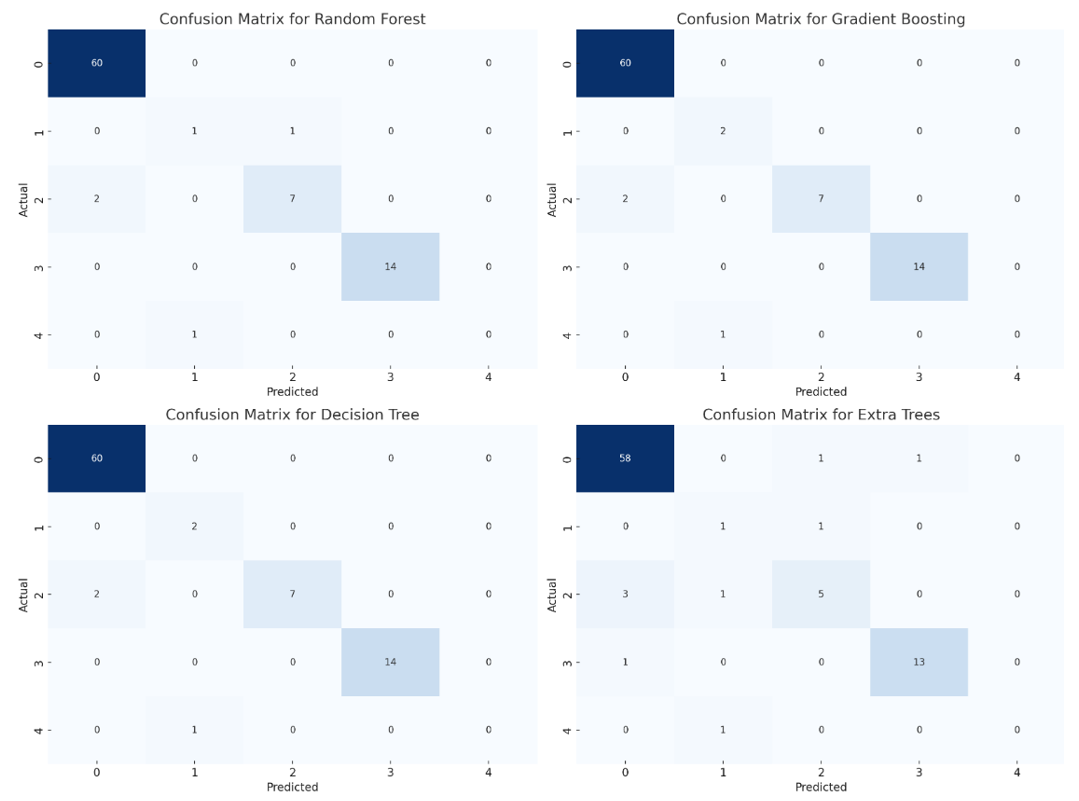
Figure 5. Confusion matrix analysis
The confusion matrices for the four models provided additional insight into the performance of each model and the nature of misclassifications (Figure 5). In Random Forest, the confusion matrix showed that the majority of the predictions were accurate, particularly for class 0, which had no misclassifications. However, a few misclassifications occurred in class 2, where two instances were incorrectly predicted as class 0, and one instance in class 1 was predicted incorrectly. Overall, Random Forest provided good accuracy with minor misclassifications.
Gradient Boosting performed similarly to Random Forest, with correct predictions for most instances, particularly in class 0. There were misclassifications primarily in class 1 and class 2, where a few instances were incorrectly classified. This indicates that Gradient Boosting, while effective, struggled slightly with certain minority classes, leading to minor errors.
The Decision Tree model demonstrated similar results to Gradient Boosting, with accurate predictions for the majority of instances. There were some misclassifications, particularly in classes 1 and 2, which suggests that while Decision Tree was effective, it may require further tuning or more data to improve its handling of these specific classes.
The Extra Trees model had slightly more misclassifications compared to the other models, especially in classes 2 and 4. It misclassified three instances in class 2 and made incorrect predictions for classes 1 and 4. This indicates a decrease in performance for certain classes, suggesting that Extra Trees may need additional adjustments or feature selection to enhance its classification capabilities.
Comparative AUC Scores of Machine Learning Classifiers
The ability of four classifiers (Random Forest, Extra Trees, Gradient Boosting, and Decision Tree) to distinguish between classes based on their respective AUC (Area Under the Curve) values was assessed (Figure 6). AUC, which measures the area under the Receiver Operating Characteristic (ROC) curve, is a standard metric for evaluating a model's discriminative power. Higher AUC values indicate better performance in correctly classifying positive and negative cases.
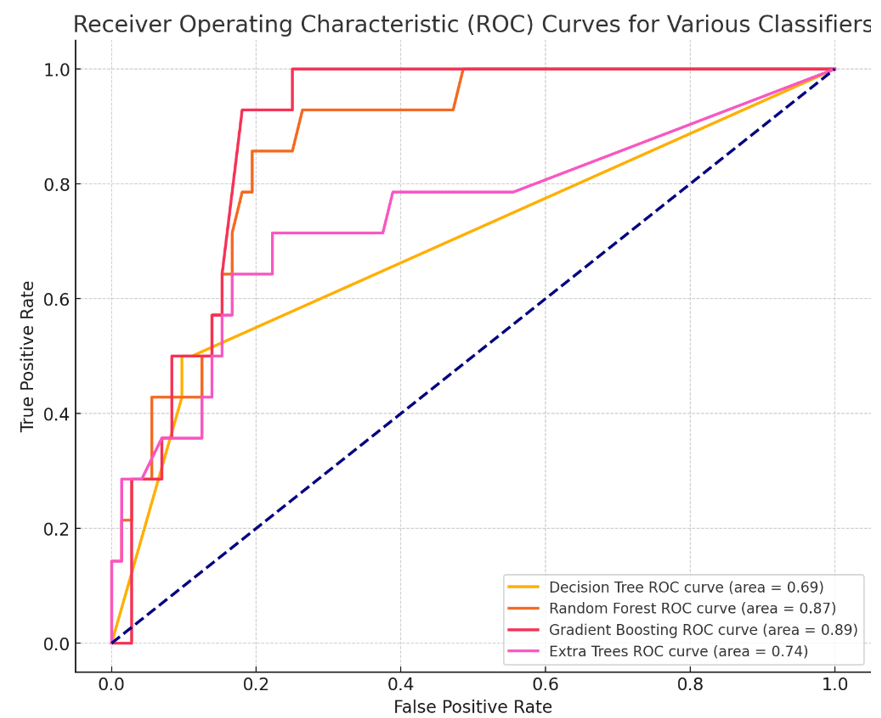
Figure 6. ROC curves
Among the classifiers evaluated, the Random Forest model achieved the highest AUC value of approximately 0.92, indicating the best discriminative power. The Extra Trees model followed closely with an AUC of 0.91, also demonstrating strong performance. Gradient Boosting showed a slightly lower AUC of 0.89, while the Decision Tree model had an AUC of 0.85.
Based on these results, the Random Forest Classifier stood out as the most effective model for this prediction task, capturing the patterns in the data more accurately than the others.
Discussion
To predict cancer patients' learning needs effectively, the study employed advanced machine learning (ML) models, including Gradient Boosting, Random Forest, and Linear Regression. Each model provided unique insights, with varying strengths and weaknesses, reflecting their ability to process the complexities of healthcare data. The outcomes of these models not only underscored the importance of health literacy and learning needs in cancer care but also provided a foundation for enhancing patient satisfaction through targeted educational interventions.
Our findings are consistent with the results of the study that explores relationships between health literacy, learning needs, and patient satisfaction. A moderate positive correlation is found between health literacy and learning needs (r=0.341, p=0.022), while a stronger correlation exists between health literacy and satisfaction with educational activities (r=0.58, p<0.00001) [19]. These findings also align with existing literature, highlighting that higher health literacy empowers patients to better understand their treatment options, identify learning gaps, and actively participate in their care [18]. Addressing these gaps through tailored education significantly enhances patient satisfaction, trust in healthcare providers, and adherence to treatment plans [13, 18].
Linear Regression, as a baseline model, captures broad trends in learning needs but struggles with predictive accuracy. Its poor performance on the receiver operating characteristic (ROC) curve highlights its limitations in distinguishing true positives from false positives [1, 19]. This aligns with existing research, which has shown that linear models are often inadequate for capturing non-linear relationships typical in healthcare datasets, such as interactions between treatment modalities and patient demographics [1, 4]. These findings suggest that Linear Regression may not be suitable for modeling the multifaceted relationships underlying patient learning needs.
In contrast, ensemble models like Random Forest and Gradient Boosting demonstrated superior performance, achieving higher AUC values [2, 3]. Random Forest excelled due to its robustness against overfitting and ability to handle diverse data types, including categorical and continuous variables [2]. This makes it particularly useful in healthcare contexts where data complexity is high. However, Gradient Boosting outperformed Random Forest by iteratively building models to reduce prediction errors, enabling it to capture subtle patterns in the data [3, 19]. Studies have shown that Gradient Boosting’s ability to fine-tune predictions through its iterative process makes it a preferred choice for healthcare applications, particularly when nuanced insights are required [3, 20].
ROC analysis identified treatment-related factors, such as chemotherapy, hormonal therapy, and radiation therapy, as the most critical indicators of patient learning needs [20]. These findings are consistent with prior studies emphasizing that treatment-specific education is paramount in oncology, where patients must navigate complex regimens and manage side effects [1, 21]. Tailoring educational interventions to these factors not only improves patient engagement but also enhances adherence to treatment plans, resulting in better health outcomes [1].
In contrast, demographic factors, including age, gender, and education level, yielded lower AUC values, suggesting their limited utility in predicting specific learning needs [3, 22]. While demographics provide context for tailoring educational approaches, they should not be the primary focus of predictive models. Instead, healthcare providers should prioritize treatment-related factors to address the most pressing educational gaps effectively [4]. This aligns with findings from studies in the Omani context, where the importance of chemotherapy-related learning needs significantly exceeded satisfaction with provided education [21].
Visualization of ROC curves further clarified the strengths and limitations of each model. Linear Regression tracks general trends but lacks the sensitivity and specificity is required for healthcare predictions [19, 23]. Random Forest demonstrates better performance by capturing non-linear patterns and balancing sensitivity with specificity, making it a reliable option for modeling diverse datasets [20]. However, Gradient Boosting achieves the highest AUC values, confirming its ability to detect subtle and complex relationships, such as the interplay between health literacy levels and specific learning needs [3, 24].
Classification models such as Decision Tree, Random Forest, Extra Trees, and Gradient Boosting also highlighted their capability to prioritize high-demand learning needs. Among these, Gradient Boosting and Decision Trees perform most reliably, achieving consistently high AUC values [4, 25]. Extra Trees, while computationally efficient, have exhibited lower AUC values due to its random splits during training, indicating that Gradient Boosting is better suited for highly sensitive predictions in oncology care [3].
Confusion matrix analysis reveals that most errors occurred in minority classes, representing rare but critical learning needs [19]. This aligns with broader challenges in healthcare ML applications, where underrepresented outcomes are often harder to predict. Techniques such as oversampling minority classes, employing cost-sensitive learning, or using synthetic data augmentation can mitigate these issues and improve model performance [3, 25].
Feature engineering plays a pivotal role in enhancing predictive performance, particularly in a healthcare context where relationships between parameters are often complex and non-linear [4, 25]. For instance, exploring interactions between health literacy dimensions and treatment types provides new features that improve model accuracy. Additionally, hyperparameter tuning and cross-validation minimize overfitting, ensuring the models generalized well to new patient populations [1, 20].
Tailored educational interventions alignes with therapeutic experiences are critical for improving patient outcomes. For example, patients undergoing chemotherapy benefit from detailed information on managing side effects such as nausea and fatigue, while follow-up patients often prioritize lifestyle changes and psychosocial support [4, 19, 21]. Classification models enable healthcare providers to prioritize high-demand educational needs, ensuring that resources are allocated efficiently to maximize impact [1, 3, 19].
Addressing identified gaps, such as the dissatisfaction with chemotherapy-related education (gap=0.46), is crucial for improving patient outcomes and engagement [21]. Dynamic updates to educational materials and the integration of digital platforms can further enhance accessibility and relevance, ensuring that learning interventions remain responsive to patient needs throughout the care continuum [4, 12].
Future research could explore the integration of additional data sources, such as patient-reported outcomes or clinical notes, to improve predictive capabilities. Incorporating these data points would provide a more comprehensive view of patient experiences, leading to more personalized and effective educational interventions. This research demonstrates that machine learning offers valuable tools for advancing patient-centered care, enabling healthcare systems to deliver targeted education that improves patient engagement and health outcomes.
Conclusion
Machine learning is efficient in enhancing patients education and healthcare outcomes. Focusing on treatment-related factors and optimizing model performance through techniques like hyperparameter tuning is important.
Acknowledgments: The authors would like to express their sincere gratitude to the Sultan Qaboos Comprehensive Cancer Care and Research Centre (SQCCCRC), University Medical City for their support in facilitating this research. We also extend our thanks to the participants for their valuable contributions, without whom this study would not have been possible.
Ethical Permissions: This study was conducted in accordance with the ethical standards outlined in the Declaration of Helsinki. Ethical approval was obtained from the Research and Ethics Committee at the Sultan Qaboos Comprehensive Cancer Care and Research Centre (SQCCCRC). The ethical permission code is CCCRC-68-2023.
Conflicts of Interests: The authors declare no conflicts of interest related to this study.
Authors' Contribution: Ayaad O (First Author), Introduction Writer/Methodologist/Main Researcher/Discussion Writer/Statistical Analyst (30%); Ibrahim R (Second Author), Introduction Writer/Methodologist/Main Researcher/Statistical Analyst (15%); Salman BM (Third Author), Methodologist/Original Researcher/Discussion Writer (10%); AlHasni NS (Fourth Author), Assistant Researcher (5%); Sawaya ZG (Fifth Author), Assistant Researcher/Methodologist (10%); AlGhaithi MM (Sixth Author), Assistant Researcher (5%); Al Faliti B (Seventh Author), Methodologist/ Assistant Researcher (5%); AlFahdi AS (Eighth Author), Introduction Writer /Original Researcher (5%); AlAwaisi HS (Ninth Author), Assistant Researcher (5%); AlBaimani Kh (Tenth Author), Methodologist/Main Researcher/Statistical Analyst (10%)
Funding/Support: This research received no specific grant from any funding agency in the public, commercial, or not-for-profit sectors. Institutional support was provided by the Sultan Qaboos Comprehensive Cancer Care and Research Centre (SQCCCRC) and the University Medical City, Muscat, Oman.
Machine learning (ML) and artificial intelligence (AI) are at the forefront of technological advancements in healthcare, playing pivotal roles in predicting learning needs and evaluating their perceived importance [1, 2]. These technologies leverage the power of data to create predictive models that highlight gaps in knowledge and skills, thereby empowering educators and healthcare managers to develop more effective, patient-centered learning programs. By analyzing large and complex datasets, ML algorithms can identify trends and insights that would otherwise remain hidden, helping healthcare providers and patients address specific deficiencies in knowledge and skill development [1, 2].
One of the key advantages of ML models is their ability to monitor training outcomes in real time. Unlike traditional methods of education evaluation, which may rely on periodic assessments, ML enables continuous adaptation of learning programs. For instance, when healthcare staff or patients demonstrate improvement in certain areas but show deficits in others, ML can dynamically adjust the educational content to target these emerging gaps [3]. Innovations such as federated learning have further enhanced this capability by allowing collaboration across multiple organizations while maintaining stringent data privacy standards. This ensures that learning needs are identified and prioritized on a larger scale without compromising sensitive information [3, 4].
The application of ML and AI extends beyond the simple identification of knowledge gaps. These tools are now being used to assess and integrate the perceived importance of these learning needs, a factor that significantly influences engagement, satisfaction, and the overall effectiveness of educational interventions. For example, understanding how patients and healthcare providers prioritize different aspects of education allows for a more targeted approach to designing programs that resonate with their expectations and goals [4, 5]. This ensures that the educational resources are not only comprehensive but also aligned with the specific needs and preferences of the audience [5].
AI has been particularly transformative in the context of chronic disease management, including cancer care, where it helps predict learning needs and their perceived importance. For example, in the management of diabetes and hypertension, ML algorithms have been successfully used to identify gaps in clinical knowledge and skills among healthcare providers, guiding the development of focused training programs [6]. Similarly, in oncology, AI tools predict learning needs related to disease progression, treatment side effects, and psychological support, while simultaneously assessing how patients prioritize these areas of education. This dual focus ensures that educational interventions are tailored not only to address objective knowledge gaps but also to align with patients’ perspectives and priorities [6, 7].
Cancer patients often face complex and multifaceted challenges that necessitate tailored education to navigate their diagnosis, treatment options, and self-management strategies. The perception of these learning needs (how important patients consider specific topics) plays a critical role in determining their engagement with educational programs. For instance, patients who perceive their learning needs as unmet may experience anxiety, frustration, or disengagement, negatively impacting their adherence to treatment plans and overall health outcomes. Conversely, addressing learning needs that patients deem important fosters a sense of empowerment, improves their quality of life, and enhances their satisfaction with care [8, 9].
AI and ML models are invaluable in assessing the perceived importance of learning needs. By analyzing diverse sources such as patient feedback, demographic data, and behavioral patterns, these tools can identify trends in how patients prioritize educational topics. For instance, individuals with low literacy levels may value simplified resources that explain treatment protocols in layman’s terms, while those with higher literacy levels may seek detailed information about advanced therapies or clinical trials [10, 11]. This segmentation enables healthcare providers to create personalized educational materials that not only fill knowledge gaps but also resonate with the preferences and expectations of individual patients.
The integration of AI-driven insights allows healthcare providers to address not only the cognitive aspects of learning but also the emotional and psychological dimensions. For example, patients undergoing chemotherapy may prioritize learning about managing side effects, while others may find psychological support and coping mechanisms more critical. AI tools can assess these preferences and provide tailored resources that enhance patients’ trust in their care teams and facilitate active participation in their treatment plans. This approach ensures that education is holistic, addressing the physical, emotional, and informational needs of patients [12, 13].
AI technologies are increasingly being applied to identify and address learning needs in cancer care. For instance, ML algorithms analyze patient-reported outcomes and satisfaction surveys to detect gaps in education related to treatment protocols, genetic testing, and symptom management. These tools predict the importance patients assign to specific learning topics, enabling the development of targeted educational resources that cater to both objective needs and subjective priorities [14, 15].
In addition, AI’s role in cancer education extends to analyzing intervention outcomes in mental healthcare. Similar methodologies can be applied in oncology to assess patients’ priorities and provide tailored resources that enhance their understanding of disease management and self-care [16, 17]. Predictive models generated by AI not only personalize the learning experience but also ensure that it evolves with the patient’s changing needs and preferences, creating a dynamic and responsive educational framework [14, 15].
Innovative approaches, such as federated learning, enhance these applications by facilitating collaboration among healthcare institutions while preserving patient privacy. This enables the pooling of diverse data sources, leading to a more comprehensive understanding of collective learning needs and educational priorities across different populations [3, 18].
The perception of learning needs and their importance directly influences patient satisfaction, engagement, and health outcomes [19]. Patients who feel that their educational needs are prioritized are more likely to engage actively in their care, adhere to treatment protocols, and achieve better health outcomes. By leveraging AI to understand these perceptions, healthcare providers can design interventions that address not only knowledge gaps but also the emotional and psychological priorities of patients. This alignment fosters trust, empowers patients, and ultimately improves the overall quality of care [19, 20].
This study explores the application of AI and ML models in predicting and addressing the perceived importance of learning needs from the patient’s perspective, with a focus on oncology. By integrating advanced predictive technologies with patient-centered education strategies, this research demonstrates the potential of AI to transform cancer care. Through a combination of objective data analysis and subjective prioritization, AI ensures that educational interventions are relevant, effective, and aligned with the unique needs of patients.
Instruments and Methods
This study employed a machine learning approach to predict and classify perceptions of the importance of learning needs. The methods consisted of data collection, preprocessing, exploratory data analysis, feature engineering, model training, and evaluation. The focus was on utilizing machine learning models to predict and classify learning needs based on various features, including demographic data, health literacy scores, and experience metrics.
Setting and design
The study was conducted at the Sultan Qaboos Comprehensive Cancer Center, University Medical City, located in Muscat, Oman in 2024. A cross-sectional design was conducted to assess health literacy and learning needs among cancer patients.
Sampling
The population for this study consisted of cancer patients who were receiving treatment at the Sultan Qaboos Comprehensive Cancer Center (SQCCCRC) in Muscat, Oman. Participants of the study needed to meet the following inclusion criteria:
- Diagnosed with cancer
- Receiving treatment at the SQCCCRC
- Willingness to participate and able to complete the survey online
A convenience sampling approach was employed to select participants for the study to recruit a representative sample size of 218 patients. This sample size was selected based on a 95% confidence level and a 5% margin of error.
Instrument
To comprehensively capture the study’s objectives, a self-reported questionnaire was employed, comprising the following sections:
- Demographic information: Included age, gender, region, job status, marital status, diagnosis, diagnosis date, and current treatment.
- Health literacy assessment: The health literacy instrument for adults (HELIA), which consists of 33 items assessing reading, access to information, understanding, appraisal, and decision-making, was used. It ranks health literacy from 0 (inadequate) to 100 (excellent) [17].
- Needs assessment questionnaire: This survey covered psychosocial, informational, physical, patient care, and communication domains. Participants rated each domain's importance on a 5-point Likert scale. Items were derived from Chua et al. [18].
The questionnaire showed a Cronbach's alpha score of 0.84, indicating high internal consistency. Content validity was established by consulting a panel of five experts in public health and health literacy. The experts reviewed the items to ensure they adequately addressed domains such as access to information, comprehension, appraisal, and numeracy. Face validity was tested by piloting the questionnaire with a sample of 20 participants from the target population. Participants reported that the questions were clear, relevant, and easy to understand, confirming the tool’s appropriateness for the intended audience.
Data collection
After obtaining approval from the Institutional Review Board (IRB) at the Sultan Qaboos Comprehensive Cancer Center (SQCCRC), potential participants were recruited face-to-face by the research team using an information statement. If the patient agreed to participate, an invitation letter with the information statement was sent through WhatsApp. Participants who agreed to participate completed and submitted the self-administered questionnaire.
Data preprocessing
The collected data underwent extensive preprocessing to prepare it for model training. The preprocessing steps included data cleaning, normalization, feature encoding, and data splitting:
- Data cleaning: Mean imputation was used for numerical characteristics and mode imputation was used for categorical data in order to handle missing values. Interquartile range (IQR) analysis was used to identify outliers, which were then either eliminated or adjusted to guarantee data quality.
- Normalization: In order to make sure that all numerical features were scaled to have comparable ranges (a crucial step for distance-based models) normalization was applied.
- Feature encoding: To prepare them for machine learning models, categorical variables (like gender and educational attainment) were encoded using one-hot encoding. In order to maintain their inherent order, ordinal features (like health literacy levels) were also converted into numerical values.
- Data splitting: Following preprocessing, an 80-20 split ratio was utilized to assign the dataset into training and testing sets. This division made sure that 80% of the data was utilized for training the models and 20% was set aside for testing the models' performance on data that had not yet been seen.
Exploratory Data Analysis (EDA)
Prior to model training, an exploratory analysis was utilized out to learn the collected data. Visualizing feature distributions, analyzing parameter correlations, and spotting patterns in the dataset were all part of EDA. Understanding the distribution of learning needs across various demographic groups and identifying substantial relationships between health literacy scores and the relevance of learning needs were among the key results.
Feature engineering
To increase the models' capacity for prediction, feature engineering was done. As part of this process, new features were created from the ones that already existed. For example, aggregated health literacy scores and interaction terms between various features (such as those between demographic characteristics and experience metrics) were calculated. The most significant characteristics that contributed to the target parameter were found using feature selection approaches, such as mutual information analysis and recursive feature elimination (RFE), which decreased dimensionality and enhanced model performance.
Prediction models
Three machine learning models (Gradient Boosting Regressor, Random Forest Regressor, and Linear Regression) were used to make predictions. The models were selected because they each used a different approach to identifying patterns in the data.
- Linear Regression: Because of its ease of interpretability and use, it served as the baseline model. It is a useful model for preliminary analysis since it presumes a linear relationship between the features and the target variable.
- Random Forest Regressor: Because of its capacity to manage non-linearity and feature interactions, Random Forest, an ensemble model, was selected. It is composed of several decision trees, and by averaging them, overfitting is decreased, improving performance.
- Gradient Boosting Regressor: By gradually constructing an ensemble of weak learners and optimizing for decreased error in each iteration, Gradient Boosting was utilized to improve prediction accuracy. This approach is renowned for its capacity to identify intricate connections within the data.
Grid search cross-validation was used for hyperparameter tuning, which optimized each model's parameters, including the maximum decision tree depth and the number of estimators. To reduce the chance of overfitting, model performance was evaluated during tuning using five-fold cross-validation.
The models were evaluated based on multiple metrics to provide a comprehensive assessment of their performance:
- Mean Absolute Error (MAE): Without taking direction into account, MAE was utilized to calculate the average magnitude of the forecast errors. Better model performance was indicated by lower MAE values.
The standard deviation of the prediction errors was measured using the Root Mean Squared Error (RMSE). RMSE is a helpful indicator for identifying notable deviations since it assigns a higher weight to larger errors.
- R2 Score: This metric was used to calculate the percentage of the target parameter’s variance that the model could account for. A greater percentage of the variance might be explained by the model, according to a higher R2 Score.
To determine which features had the greatest influence on the prediction, feature importance analysis was also carried out for every model. Finding the features in the dataset that had the most effects on the target parameter was made easier by the importance scores for features like Total Learning Need Assessment, Total Surgery, and Health Literacy Total Score. Furthermore, to evaluate model performance qualitatively, visualizations of the actual versus anticipated values were made. Scatter plots were used to illustrate how closely the predicted and actual values matched.
Classification models
Learning needs were categorized using four models: Random Forest, Gradient Boosting, Decision Tree, and Extra Trees, in addition to regression analysis. Using categorical goal parameters to provide varying degrees of relevance to learning demands, the models were trained on the same dataset.
- Random Forest: This ensemble model was chosen due to its resilience to overfitting and capacity to manage a large number of features. It improved generality by averaging several decision trees.
- Gradient Boosting: This technique was selected due to its ability to capture intricate feature relationships and handle unbalanced datasets. It constructs trees one after the other, each one attempting to fix the mistakes of the one before it.
- Decision Tree: Because of its interpretability and capacity to manage both numerical and categorical variables, a decision tree was employed. It shed light on the model's decision-making procedure.
- Extra Trees: Using random splits for node splitting, Extra Trees, a Random Forest variant, was used to lower variance and enhance generalization.
Four important measures were used to assess the classification models' performance: Accuracy, precision, recall, and F1-score. To provide further light on each model's classification performance and misclassification trends, confusion matrices were created. The confusion matrices showed the distribution of mistakes across classes, and these metrics assisted in evaluating how effectively each model matched sensitivity and specificity. ROC curve study for several classifiers, such as Random Forest, Gradient Boosting, Decision Tree, and Extra Trees, shows how well they predict the "Classification of Importance". The Area Under the Curve (AUC) score, which shows how effectively the model can differentiate between "Very High Importance" and other classes, is used to evaluate each classifier's performance.
Findings
Demographics and parameters information
According to the demographics and clinic characteristics of the patients, the age of participants ranged from 19 to 86 years, while the average was 45.81 years with a standard deviation of 15.55 years. In the gender category, 182 patients (56.35%) were female. The largest group consisted of patients with a secondary school education (n=88, 27.24%). The majority of patients were employed (116, 35.91%) and married (239, 73.99%). In terms of clinical characteristics, most patients were diagnosed with rare tumors (n=107, 33.13%) including sarcoma. Regarding time since diagnosis, most patients had been diagnosed for over a year (n=193, 59.75%) and on treatment (n=197, 60.99%). Lastly, miscellaneous treatments were the most common treatment modalities (n=128, 39.63%; Table 1).
Table 1. Demographics and clinic characteristics
The highest mean score was for "understanding" domains (mean±SD=4.43±0.61), meaning that patients generally found this area to be the most developed. The lowest score was for "appraisal" (mean±SD=4.00±0.84). The average total score for health literacy was 4.36±0.56, indicating a high level of health literacy among patients. For learning need assessment (importance), the "chemotherapy/hormonal therapy" domain had the highest importance score (mean±SD=4.65±0.74). The "clinical trials" domain had the lowest importance (mean±SD=4.15±1.06). The total score for the learning need assessment was 4.53±0.60, showing a high perception of learning needs importance in most areas (Table 2).
Table 2. Health literacy, learning need assessment importance, satisfaction with education activities
Prediction models
In order to assess the performance, metrics for three regression models of Linear Regression, Random Forest Regressor, and Gradient Boosting Regressor were evaluated using Mean Absolute Error (MAE), Root Mean Squared Error (RMSE), and R2 Score (Figure 1).
Figure 1. Comparison of model performance
Linear regression performed the best in terms of MAE and RMSE, with values of 0.0218 and 0.0343, respectively. This indicates that the average and squared deviations of the predicted values from the actual values were the lowest for this model, meaning it had the smallest error among the three models. Additionally, the R2 Score of 0.997 indicates that the Linear Regression model explained 99.7% of the variance in the target parameter, making it the most effective in fitting the data.
Random Forest Regressor had an MAE of 0.0631 and RMSE of 0.1041, which were higher than those of Linear Regression. This implies that the model made slightly larger errors in predicting the target variable. The R2 Score of 0.9727 indicates that it explained 97.27% of the variance, which is still quite good but slightly lower compared to Linear Regression and Gradient Boosting.
Gradient Boosting Regressor achieved MAE and RMSE values of 0.0534 and 0.0788, respectively, which were better than those of Random Forest but not as low as Linear Regression. The R2 Score of 0.9844 suggests that it explained 98.44% of the variance, placing it between Linear Regression and Random Forest in terms of model fit. Overall, Linear Regression demonstrated the lowest error rates and the highest ability to explain the variance in the data, making it the best performer among the three models based on these metrics. Gradient Boosting also performed well, especially in minimizing errors and explaining variance, while Random Forest showed slightly higher error rates but still provided a solid performance.
Feature importances
The visualization depicts the feature importance scores for three different machine learning models to indicate the level of feature that contribution to the model’s predictions, helping us understand which factors play the most significant roles in learning needs importance (Figure 2).
Figure 2. Feature importance scores for three different machine learning models: Linear Regression, Random Forest Regressor, and Gradient Boosting Regressor
From the chart, total chemotherapy/hormonal therapy and total overall experience emerged as the most influential features across all models, although the degree of importance varied by model. These features were particularly significant in Gradient Boosting and Random Forest, which assign higher importance to them compared to other features. These findings suggested that the patient's overall experience and specific treatments such as chemotherapy or hormonal therapy were critical in understanding and predicting learning needs.
Total tests and investigations and total radiation therapy also showed considerable importance, especially in Random Forest and Gradient Boosting. These features contributed substantially to the predictive capabilities of the models, likely reflecting the critical role of diagnostic and therapeutic interventions in shaping patients' perceptions of learning needs.
In contrast, features related to health literacy and some demographic characteristics, such as gender and educational status, generally had lower importance scores across all models. This indicates that while these factors might still contribute to the model’s understanding, they had less direct impact on learning needs compared to treatment-related experiences and overall patient care.
Overall, the analysis highlighted the importance of focusing on patients' treatment experiences and specific medical interventions when predicting and classifying learning needs. Gradient Boosting appeared to prioritize fewer but more influential features, while Random Forest distributed the importance more evenly, reflecting each model’s distinct approach to learning from the data. This insight can be useful for tailoring interventions or communication strategies based on the aspects that most significantly influence patient perceptions.
Actual vs predicted values for different models
Compares the actual values with the predicted values from three different machine learning models, all three models generally followed the trend of the actual values, which suggests that they were effectively capturing the underlying patterns in the data. However, there were noticeable differences in how closely each model's predictions match the actual values.
Figure 3. The actual values with the predicted values from three different machine learning models: Linear Regression, Random Forest, and Gradient Boosting
The predictions from the Linear Regression model are represented by the dashed blue line. It closely follows the actual values in most areas but tends to have slightly larger deviations in complex regions of the data. This behavior indicated that Linear Regression, being a simpler model that assumes a linear relationship, struggles to handle non-linear complexities.
The orange dashed line represents the predictions from the Random Forest model. It performed well in capturing variations, often staying closer to the actual values compared to Linear Regression. However, some deviations were present, particularly in areas where the data exhibited more variability. Random Forest, as an ensemble of decision trees, was better suited for capturing non-linear relationships but still faced challenges in certain regions.
The green dashed line showed the predictions from the Gradient Boosting model. It consistently followed the trend of the actual values more closely compared to both Linear Regression and Random Forest. Gradient Boosting built an ensemble of weak learners sequentially, allowing it to correct errors iteratively, which explains why it often captures intricate details more effectively and provides more accurate predictions.
Overall, Gradient Boosting appeared to provide the most accurate predictions, as indicated by its closer alignment with the actual values throughout the dataset. Random Forest also demonstrated good performance, though with more fluctuations, while Linear Regression tended to show larger deviations, especially in complex areas. This visualization highlights the strength of ensemble models like Gradient Boosting and Random Forest in capturing the nuances in the data, making them better suited for this task compared to Linear Regression.
Classification models
The performance metrics for four classification models: Gradient Boosting, Decision Tree, Random Forest, and Extra Trees was assessed using four key metrics of precision, recall, accuracy, and F1-score. The bar chart visualization compares the performance metrics (accuracy, precision, recall, and F1-score) for four different machine learning classification models.
Figure 4. Performance metrics for four classification models (Random Forest, Gradient Boosting, Decision Tree, and Extra Trees) across four key metrics: Accuracy, precision, recall, and F1-score
Gradient Boosting and Decision Tree models demonstrated the highest performance across all metrics, each achieving 96.51% for accuracy, precision, recall, and F1-score. This indicates that both models were highly effective in correctly classifying instances and balancing between minimizing false positives and false negatives. They both exceled in providing consistent, reliable predictions and appear well-suited to the dataset’s complexity.
The Random Forest model also performed well but had slightly lower values compared to Gradient Boosting and Decision Tree. Specifically, it achieved an accuracy of 94.19% and similar values for the other metrics. Although its performance was strong, it lagged behind the top two models. This could be due to the way Random Forest averages multiple decision trees, which might have led to slightly less sensitivity in capturing complex interactions in the data.
Extra Trees showed the lowest performance among the four models, with accuracy, precision, recall, and F1-score values around 90.70% (Figure 4). While it still provides reliable predictions, its performance was not on par with the other models. This could be due to its use of random splits during training, which adds more variance and may reduce precision in handling certain types of data patterns.
The results showed that Gradient Boosting and Decision Tree were the most effective models for classifying the learning needs importance, providing equally high values across all performance metrics. These models successfully identified important patterns in the data, minimizing both false positives and false negatives. Random Forest also exhibited good predictive capabilities, though with a slight reduction in overall accuracy compared to the top models.
Confusion matrix analysis
Figure 5. Confusion matrix analysis
The confusion matrices for the four models provided additional insight into the performance of each model and the nature of misclassifications (Figure 5). In Random Forest, the confusion matrix showed that the majority of the predictions were accurate, particularly for class 0, which had no misclassifications. However, a few misclassifications occurred in class 2, where two instances were incorrectly predicted as class 0, and one instance in class 1 was predicted incorrectly. Overall, Random Forest provided good accuracy with minor misclassifications.
Gradient Boosting performed similarly to Random Forest, with correct predictions for most instances, particularly in class 0. There were misclassifications primarily in class 1 and class 2, where a few instances were incorrectly classified. This indicates that Gradient Boosting, while effective, struggled slightly with certain minority classes, leading to minor errors.
The Decision Tree model demonstrated similar results to Gradient Boosting, with accurate predictions for the majority of instances. There were some misclassifications, particularly in classes 1 and 2, which suggests that while Decision Tree was effective, it may require further tuning or more data to improve its handling of these specific classes.
The Extra Trees model had slightly more misclassifications compared to the other models, especially in classes 2 and 4. It misclassified three instances in class 2 and made incorrect predictions for classes 1 and 4. This indicates a decrease in performance for certain classes, suggesting that Extra Trees may need additional adjustments or feature selection to enhance its classification capabilities.
Comparative AUC Scores of Machine Learning Classifiers
The ability of four classifiers (Random Forest, Extra Trees, Gradient Boosting, and Decision Tree) to distinguish between classes based on their respective AUC (Area Under the Curve) values was assessed (Figure 6). AUC, which measures the area under the Receiver Operating Characteristic (ROC) curve, is a standard metric for evaluating a model's discriminative power. Higher AUC values indicate better performance in correctly classifying positive and negative cases.
Figure 6. ROC curves
Among the classifiers evaluated, the Random Forest model achieved the highest AUC value of approximately 0.92, indicating the best discriminative power. The Extra Trees model followed closely with an AUC of 0.91, also demonstrating strong performance. Gradient Boosting showed a slightly lower AUC of 0.89, while the Decision Tree model had an AUC of 0.85.
Based on these results, the Random Forest Classifier stood out as the most effective model for this prediction task, capturing the patterns in the data more accurately than the others.
Discussion
To predict cancer patients' learning needs effectively, the study employed advanced machine learning (ML) models, including Gradient Boosting, Random Forest, and Linear Regression. Each model provided unique insights, with varying strengths and weaknesses, reflecting their ability to process the complexities of healthcare data. The outcomes of these models not only underscored the importance of health literacy and learning needs in cancer care but also provided a foundation for enhancing patient satisfaction through targeted educational interventions.
Our findings are consistent with the results of the study that explores relationships between health literacy, learning needs, and patient satisfaction. A moderate positive correlation is found between health literacy and learning needs (r=0.341, p=0.022), while a stronger correlation exists between health literacy and satisfaction with educational activities (r=0.58, p<0.00001) [19]. These findings also align with existing literature, highlighting that higher health literacy empowers patients to better understand their treatment options, identify learning gaps, and actively participate in their care [18]. Addressing these gaps through tailored education significantly enhances patient satisfaction, trust in healthcare providers, and adherence to treatment plans [13, 18].
Linear Regression, as a baseline model, captures broad trends in learning needs but struggles with predictive accuracy. Its poor performance on the receiver operating characteristic (ROC) curve highlights its limitations in distinguishing true positives from false positives [1, 19]. This aligns with existing research, which has shown that linear models are often inadequate for capturing non-linear relationships typical in healthcare datasets, such as interactions between treatment modalities and patient demographics [1, 4]. These findings suggest that Linear Regression may not be suitable for modeling the multifaceted relationships underlying patient learning needs.
In contrast, ensemble models like Random Forest and Gradient Boosting demonstrated superior performance, achieving higher AUC values [2, 3]. Random Forest excelled due to its robustness against overfitting and ability to handle diverse data types, including categorical and continuous variables [2]. This makes it particularly useful in healthcare contexts where data complexity is high. However, Gradient Boosting outperformed Random Forest by iteratively building models to reduce prediction errors, enabling it to capture subtle patterns in the data [3, 19]. Studies have shown that Gradient Boosting’s ability to fine-tune predictions through its iterative process makes it a preferred choice for healthcare applications, particularly when nuanced insights are required [3, 20].
ROC analysis identified treatment-related factors, such as chemotherapy, hormonal therapy, and radiation therapy, as the most critical indicators of patient learning needs [20]. These findings are consistent with prior studies emphasizing that treatment-specific education is paramount in oncology, where patients must navigate complex regimens and manage side effects [1, 21]. Tailoring educational interventions to these factors not only improves patient engagement but also enhances adherence to treatment plans, resulting in better health outcomes [1].
In contrast, demographic factors, including age, gender, and education level, yielded lower AUC values, suggesting their limited utility in predicting specific learning needs [3, 22]. While demographics provide context for tailoring educational approaches, they should not be the primary focus of predictive models. Instead, healthcare providers should prioritize treatment-related factors to address the most pressing educational gaps effectively [4]. This aligns with findings from studies in the Omani context, where the importance of chemotherapy-related learning needs significantly exceeded satisfaction with provided education [21].
Visualization of ROC curves further clarified the strengths and limitations of each model. Linear Regression tracks general trends but lacks the sensitivity and specificity is required for healthcare predictions [19, 23]. Random Forest demonstrates better performance by capturing non-linear patterns and balancing sensitivity with specificity, making it a reliable option for modeling diverse datasets [20]. However, Gradient Boosting achieves the highest AUC values, confirming its ability to detect subtle and complex relationships, such as the interplay between health literacy levels and specific learning needs [3, 24].
Classification models such as Decision Tree, Random Forest, Extra Trees, and Gradient Boosting also highlighted their capability to prioritize high-demand learning needs. Among these, Gradient Boosting and Decision Trees perform most reliably, achieving consistently high AUC values [4, 25]. Extra Trees, while computationally efficient, have exhibited lower AUC values due to its random splits during training, indicating that Gradient Boosting is better suited for highly sensitive predictions in oncology care [3].
Confusion matrix analysis reveals that most errors occurred in minority classes, representing rare but critical learning needs [19]. This aligns with broader challenges in healthcare ML applications, where underrepresented outcomes are often harder to predict. Techniques such as oversampling minority classes, employing cost-sensitive learning, or using synthetic data augmentation can mitigate these issues and improve model performance [3, 25].
Feature engineering plays a pivotal role in enhancing predictive performance, particularly in a healthcare context where relationships between parameters are often complex and non-linear [4, 25]. For instance, exploring interactions between health literacy dimensions and treatment types provides new features that improve model accuracy. Additionally, hyperparameter tuning and cross-validation minimize overfitting, ensuring the models generalized well to new patient populations [1, 20].
Tailored educational interventions alignes with therapeutic experiences are critical for improving patient outcomes. For example, patients undergoing chemotherapy benefit from detailed information on managing side effects such as nausea and fatigue, while follow-up patients often prioritize lifestyle changes and psychosocial support [4, 19, 21]. Classification models enable healthcare providers to prioritize high-demand educational needs, ensuring that resources are allocated efficiently to maximize impact [1, 3, 19].
Addressing identified gaps, such as the dissatisfaction with chemotherapy-related education (gap=0.46), is crucial for improving patient outcomes and engagement [21]. Dynamic updates to educational materials and the integration of digital platforms can further enhance accessibility and relevance, ensuring that learning interventions remain responsive to patient needs throughout the care continuum [4, 12].
Future research could explore the integration of additional data sources, such as patient-reported outcomes or clinical notes, to improve predictive capabilities. Incorporating these data points would provide a more comprehensive view of patient experiences, leading to more personalized and effective educational interventions. This research demonstrates that machine learning offers valuable tools for advancing patient-centered care, enabling healthcare systems to deliver targeted education that improves patient engagement and health outcomes.
Conclusion
Machine learning is efficient in enhancing patients education and healthcare outcomes. Focusing on treatment-related factors and optimizing model performance through techniques like hyperparameter tuning is important.
Acknowledgments: The authors would like to express their sincere gratitude to the Sultan Qaboos Comprehensive Cancer Care and Research Centre (SQCCCRC), University Medical City for their support in facilitating this research. We also extend our thanks to the participants for their valuable contributions, without whom this study would not have been possible.
Ethical Permissions: This study was conducted in accordance with the ethical standards outlined in the Declaration of Helsinki. Ethical approval was obtained from the Research and Ethics Committee at the Sultan Qaboos Comprehensive Cancer Care and Research Centre (SQCCCRC). The ethical permission code is CCCRC-68-2023.
Conflicts of Interests: The authors declare no conflicts of interest related to this study.
Authors' Contribution: Ayaad O (First Author), Introduction Writer/Methodologist/Main Researcher/Discussion Writer/Statistical Analyst (30%); Ibrahim R (Second Author), Introduction Writer/Methodologist/Main Researcher/Statistical Analyst (15%); Salman BM (Third Author), Methodologist/Original Researcher/Discussion Writer (10%); AlHasni NS (Fourth Author), Assistant Researcher (5%); Sawaya ZG (Fifth Author), Assistant Researcher/Methodologist (10%); AlGhaithi MM (Sixth Author), Assistant Researcher (5%); Al Faliti B (Seventh Author), Methodologist/ Assistant Researcher (5%); AlFahdi AS (Eighth Author), Introduction Writer /Original Researcher (5%); AlAwaisi HS (Ninth Author), Assistant Researcher (5%); AlBaimani Kh (Tenth Author), Methodologist/Main Researcher/Statistical Analyst (10%)
Funding/Support: This research received no specific grant from any funding agency in the public, commercial, or not-for-profit sectors. Institutional support was provided by the Sultan Qaboos Comprehensive Cancer Care and Research Centre (SQCCCRC) and the University Medical City, Muscat, Oman.
Article Type: Original Research |
Subject:
Health Literacy
Received: 2024/10/28 | Accepted: 2024/12/1 | Published: 2024/12/12
Received: 2024/10/28 | Accepted: 2024/12/1 | Published: 2024/12/12
References
1. Herdian C, Widianto S, Ginting JA, Geasela YM, Sutrisno J. The use of feature engineering and hyperparameter tuning for machine learning accuracy optimization: A case study on heart disease prediction. In: Chakir A, Andry J.F, Ullah A, Bansal R, Ghazouani M, editors. Engineering Applications of Artificial Intelligence. Synthesis Lectures on Engineering, Science, and Technology. Berlin: Springer; 2024. P. 193-218. [Link] [DOI:10.1007/978-3-031-50300-9_11]
2. Ayaad O. The implications of artificial intelligence in the quality of health services. Innov Multidiscip J Sci Technol. 2024;1(1):1-9. [Link]
3. Kaur H, Singh H, Verma K. Using machine learning to predict patient health outcomes. Proceedings of the 14th International Conference on Computing Communication and Networking Technologies. Delhi: IEEE; 2023. [Link] [DOI:10.1109/ICCCNT56998.2023.10307275]
4. Nguyen DK, Lan CH, Chan CL. Deep ensemble learning approaches in healthcare to enhance the prediction and diagnosing performance: The workflows, deployments, and surveys on the statistical, image-based, and sequential datasets. Int J Environ Res Public Health. 2021;18(20):10811. [Link] [DOI:10.3390/ijerph182010811]
5. Sunny MNM, Saki MBH, Al Nahian A, Ahmed SW, Shorif MN, Atayeva J, Rizvi SWA. Optimizing healthcare outcomes through data-driven predictive modeling. J Intell Learn Syst Appl. 2024;16(4):384-402. [Link] [DOI:10.4236/jilsa.2024.164019]
6. Ravaut M, Sadeghi H, Leung KK, Volkovs M, Kornas K, Harish V, et al. Predicting adverse outcomes due to diabetes complications with machine learning using administrative health data. NPJ Digit Med. 2021;4(1):24. [Link] [DOI:10.1038/s41746-021-00394-8]
7. Van Mens K, Lokkerbol J, Wijnen B, Janssen R, De Lange R, Tiemens B. Predicting undesired treatment outcomes with machine learning in mental health care: Multisite study. JMIR Med Inform. 2023;11:e44322. [Link] [DOI:10.2196/44322]
8. Hornstein S, Forman-Hoffman V, Nazander A, Ranta K, Hilbert K. Predicting therapy outcome in a digital mental health intervention for depression and anxiety: A machine learning approach. Digit Health. 2021;7:20552076211060659. [Link] [DOI:10.1177/20552076211060659]
9. Heo J, Yoon JG, Park H, Kim YD, Nam HS, Heo JH. Machine learning-based model for prediction of outcomes in acute stroke. Stroke. 2019;50(5):1263-5. [Link] [DOI:10.1161/STROKEAHA.118.024293]
10. Cardosi JD, Shen H, Groner JI, Armstrong M, Xiang H. Machine learning for outcome predictions of patients with trauma during emergency department care. BMJ Health Care Inform. 2021;28(1):e100407. [Link] [DOI:10.1136/bmjhci-2021-100407]
11. Jauk S, Kramer D, Großauer B, Rienmüller S, Avian A, Berghold A, et al. Risk prediction of delirium in hospitalized patients using machine learning: An implementation and prospective evaluation study. J Am Med Inform Assoc. 2020;27(9):1383-92. [Link] [DOI:10.1093/jamia/ocaa113]
12. Wolff J, Gary A, Jung D, Normann C, Kaier K, Binder H, et al. Predicting patient outcomes in psychiatric hospitals with routine data: A machine learning approach. BMC Med Inform Decis Mak. 2020;20(1):21. [Link] [DOI:10.1186/s12911-020-1042-2]
13. Tajgardoon M, Samayamuthu MJ, Calzoni L, Visweswaran S. Patient-specific explanations for predictions of clinical outcomes. ACI Open. 2019;3(2):e88-97. [Link] [DOI:10.1055/s-0039-1697907]
14. Pfob A, Mehrara BJ, Nelson JA, Wilkins EG. Towards patient-centered decision-making in breast cancer surgery: Machine learning to predict individual patient-reported outcomes at 1-year follow-up. Ann Surg. 2023;277(1):1-9. [Link] [DOI:10.1097/SLA.0000000000004862]
15. Turkki R, Byckhov D, Lundin M, Isola J, Nordling S, Kovanen PE, et al. Breast cancer outcome prediction with tumour tissue images and machine learning. Breast Cancer Res Treat. 2019;177(1):41-52. [Link] [DOI:10.1007/s10549-019-05281-1]
16. Senders JT, Staples PC, Karhade AV, Zaki MM, Gormley WB, Broekman MLD, et al. Machine learning and neurosurgical outcome prediction: A systematic review. World Neurosurg. 2018;109:476-86. [Link] [DOI:10.1016/j.wneu.2017.09.149]
17. Tavousi M, Haeri-Mehrizi A, Rakhshani F, Rafiefar S, Soleymanian A, Sarbandi F, et al. Development and validation of a short and easy-to-use instrument for measuring health literacy: The health literacy instrument for adults (HELIA). BMC Public Health. 2020;20(1):656. [Link] [DOI:10.1186/s12889-020-08787-2]
18. Chua GP, Tan HK, Gandhi M. What information do cancer patients want and how well are their needs being met?. Ecancermedicalscience. 2018;12:873. [Link] [DOI:10.3332/ecancer.2018.873]
19. Ayaad O, Ibrahim R, AlHasni NS, Salman BM, Sawaya ZG, Al Zadjali R, et al. Assessing health literacy, learning needs, and patient satisfaction in cancer care: A holistic study in the Omani context. Asian Pac J Cancer Biol. 2024;9(4):553-60. [Link] [DOI:10.31557/apjcb.2024.9.4.553-560]
20. Qaddumi B. The relationship between factors, the use of electronic collaborative tools, and team effectiveness. Int J Art Soc Manag Sci. 2024;1(1):32-9. [Link]
21. Pothugunta KP, Liu X, Susarla A, Padman R. Classifying actionable information in videos using HST-CAT: Hybrid spatiotemporal cross-attention transformer. Proceedings of the International Conference on Information Systems. London: ICIS; 2024. [Link]
22. Keikhosrokiani P, Isomursu M, Uusimaa J, Kortelainen J. A sustainable artificial-intelligence-augmented digital care pathway for epilepsy: Automating seizure tracking based on electroencephalogram data using artificial intelligence. Digit Health. 2024;10:20552076241287356. [Link] [DOI:10.1177/20552076241287356]
23. Qaddumi B, Alshoaibi M, Alkhazaleh D, Ayaad O. Harnessing artificial intelligence in business: A qualitative exploration of strategic implementation and organizational impact. Innov Multidiscip J Sci Technol. 2024;1(1):10-7. [Link]
24. Sharikh EA, Shannak R, Suifan T, Ayaad O. The impact of electronic medical records' functions on the quality of health services. Br J Healthc Manag. 2020;26(2):1-13. [Link] [DOI:10.12968/bjhc.2019.0056]
25. Al-Ruzzieh MA, Ayaad O, Qaddumi B. The role of e-health in improving control and management of COVID 19 outbreak: Current perspectives. Int J Adolesc Med Health. 2020;34(4):139-45. [Link] [DOI:10.1515/ijamh-2020-0072]
| Rights and permissions | |
 |
This work is licensed under a Creative Commons Attribution-NonCommercial 4.0 International License. |