


Volume 9, Issue 5 (2021)
Health Educ Health Promot 2021, 9(5): 487-499 |
Back to browse issues page

Download citation:
BibTeX | RIS | EndNote | Medlars | ProCite | Reference Manager | RefWorks
Send citation to:


BibTeX | RIS | EndNote | Medlars | ProCite | Reference Manager | RefWorks
Send citation to:
Karmanovskaya N, Nosova O, Kaverzin A. Public Environmental Monitoring of the State of Snowpack in Norilsk. Health Educ Health Promot 2021; 9 (5) :487-499
URL: http://hehp.modares.ac.ir/article-5-55986-en.html
URL: http://hehp.modares.ac.ir/article-5-55986-en.html
1- Department of Non-Ferrous Metallurgy; Department of Graduate Studies and Scientific Research, Norilsk State Industrial Institute, Norilsk, Russian Federation , karmanovskaya6140@nuos.pro
2- Department of Non-Ferrous Metallurgy, Norilsk State Industrial Institute, Norilsk, Russian Federation
2- Department of Non-Ferrous Metallurgy, Norilsk State Industrial Institute, Norilsk, Russian Federation
Full-Text [PDF 1130 kb]
(2908 Downloads)
| Abstract (HTML) (1234 Views)
Full-Text: (453 Views)
Introduction
Show cover is a key element in monitoring and forecasting flood conditions since precipitation shows feed surface and groundwater, which largely depends on the distribution of show cover, its physical properties, and the nature of show melting—influencing the temperature and water regime. Influencing the regime of soils, the show cover itself becomes a powerful climate-forming factor [1-5].
Norilsk is located north of the Krasnoyarsk Krai and is the district’s administrative centre. The region is a zone of permafrost rocks, whose thickness is 40-80 m. It is one of the coldest cities in the world. It is much colder than Murmansk, even though both cities are located almost at the same latitude. Norilsk is located 300 km north of the Arctic Circle, 2400 km from the North Pole, and 1500 km to the capital of the Krasnoyarsk Krai. It is considered that Norilsk ranks second in pollution of air, into which enterprises annually emit large amounts of sulphur dioxide, phenols, and heavy metal particles. The cold and long winter with January temperatures of -40⁰C is exacerbated by very strong winds. The period of severe cold lasts about 280 days, from mid-September to early May, of which blizzards accompany 130 days. The summer period begins at the end of June and lasts until the end of August. On average, the frost-free period lasts 84 days, and sometimes its duration is reduced to 53 days. The relative humidity is 76%. The snow cover can lie from 244 to 277 days.
Snow is a good sorbing agent. Therefore, it imbibes solid and gaseous pollutants from the atmosphere. It is possible to judge air pollution from enterprises and transport emissions by the state of the snow cover. During the thawing period, pollutants contained in the snow cover enter the soil and water bodies, causing environmental damage.
It was established that zinc determines the total show cover contamination index, as well as in the case of soil. A high positive correlation was found between the coefficient of zinc concentration in the show cover and soil, which may indicate a constant supply of this pollution index. Winter flux is an important assessment element when estimating the annual carbon budget on a regional and global scale. The scientific sanitary assessment of water is one of the most difficult problems of sanitary examination. Snellen font for measuring water transparency [5-10].
Colour is a natural property of meltwater due to humic substances formed when organic compounds are destroyed in the soil, are washed out of it, and give snow and meltwater a colour from yellowish to brown. The colour of meltwater can be imparted by iron compounds (yellow-greenish colouration), flowering algae, suspended solids, sewage pollution, etc. The colour of meltwater is determined photometrically; it should not be higher than 20°, then the water is considered colourless.
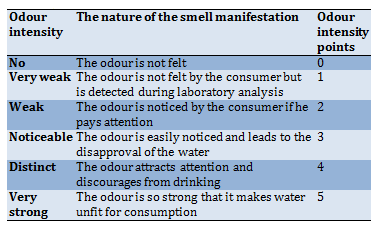
Pure snow is odourless. It should be borne in mind that the smell can appear in the meltwater due to contamination with organic and inorganic impurities. The nature and intensity of the odour are determined by the perceived smell. There are two groups of odours: natural and artificial odours. The intensity of the liquid odour is assessed using a 5-point system, presented in Table 1. The smell of water should not exceed 2 points.
Table 1) Odour intensity assessment
Transparency is a water quality indicator that simplifies and quickly controls suspended solids' content and colloidal impurities. The measure of transparency is the height of the water column through which the control object can still be observed. Depending on the type of this object, it is customary to distinguish between several types of transparency. When observing a white (usually porcelain) board or disc with a diameter of 20 cm, the "transparency over the disc" is determined. This value is measured only for waters of surface water bodies (rivers, lakes, reservoirs). Transparency (turbidity) depends on the presence of suspended solids of mineral or organic origin in the meltwater; increased turbidity indicates its contamination with solid particles from the air.
Hydrogen ion exponent (pH) - characterises the concentration of free hydrogen ions in water and expresses the degree of acidity or alkalinity of water (the ratio of H+ and OH- ions in water formed during the water dissociation) and is quantitatively determined by the concentration of hydrogen ions pH = - Ig [H+]. The pH value in river waters usually varies within 6.5-8.5, in atmospheric precipitation 4.6-6.1, in swamps 5.5-6.0, in sea waters 7.9-8.3. By the requirements for the composition and properties of water in reservoirs near drinking water points, water bodies in recreational areas, as well as water in fishery water bodies, the pH value should not go beyond the 6.5-8.5 range.
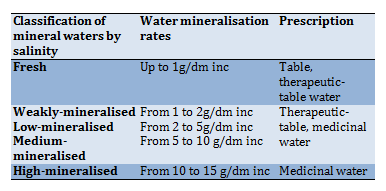
Salinity (total mineralisation) is a quantitative indicator of the content of substances dissolved in water. It is also called the total salt content since the substances dissolved in water are salts. The most common inorganic salts (bicarbonates, chlorides, and sulphates of calcium, magnesium, potassium, and sodium) and a small amount of organic matter soluble in water. The total mineralisation is confused with the dry residue. These parameters are very close, but the methods for determining them are different. When determining the dry residue, more volatile organic compounds dissolved in water are not considered. As a result, the total salinity and dry matter may differ by these volatile compounds (usually no more than 10%). The salinity level in drinking water is due to water quality in natural sources (which vary significantly in different geological regions due to the different solubility of minerals; Table 2).
In addition to factors caused by nature, anthropogenic factors greatly influence the general mineralisation of water: industrial wastewater, urban stormwater runoff (salt is used in winter as a de-icing agent), etc. According to the World Health Organisation, there is no reliable information on the health effects of high salt content.
Table 2) Categories of water salinity

For medical reasons, the WHO does not impose restrictions. As a rule, water taste is considered normal with a total mineralisation of up to 600mg/L, with a salt content of more than 1000-1200mg/L; water can cause complaints from consumers; in this regard, WHO recommends a limit for total mineralisation of 1000mg/L for organoleptic indications. This level may vary depending on prevailing habits and local conditions. People consume low salt content in developed countries - water purified by reverse osmosis technology. Such water is the purest and most harmless; it is widely used in the food industry, bottled water, etc. See: “Water and mineral matter” for more information on minerals and water. A separate topic is the value of mineralisation during the scaling and precipitation in the heating, boiler, and plumbing equipment. In this case, special requirements apply to the water, and the lower the level of mineralisation (especially the content of hardness salts), the better.
The presence of ferrous and ferric iron, manganese, aluminium, nitrate, etc., does not seriously affect electrical conductivity (unless, of course, these ions are contained in water in significant quantities). Electrical conductivity is not standardised, but a value of 2000μS/cm roughly corresponds to the total mineralisation of 1000mg/L. As already noted, the electrical conductivity changes with temperature, leading to measurement errors. With the help of electrical conductivity, it is possible to indirectly estimate the electrochemical composition of water and compare it with the parameters of the favourable environment for the development of living organisms. Conductometers are devices for measuring resistivity or conductivity used to monitor the quality of water, condensate or steam. The main purpose of conductometers is to analyse the properties and quality of water its suitability for economical use.
Hypothesis: the snow cover accumulates pollutants found in dust-gas emissions from industrial enterprises and vehicle exhaust gases. Therefore, this study aims to analyse the snow cover in the Norilsk industrial region and assess the state of atmospheric air in the winter. To achieve this goal, it is necessary to solve the following tasks: conduct a literature review on a given topic; take samples of snow in various industrial districts of Norilsk (IDN) (from the streets and near the roadsides); study the dependence of the qualitative characteristics of snow on the sampling site; conclude the quality of snow cover in different areas of the IDN. Stages of research:
1. Conducting a literature review.
2. Preparing an experiment programme.
3. Snow sampling.
4. Preparation of reagents and equipment for the experiment.
5. Carrying out an experiment.
6. Processing of the received data and plotting of dependency diagrams.
7. Preparing a written report on the results of research work.
Materials and Methods
This experimental study was conducted in 2019. The organoleptic (ancient Greek: ὄργανον – tool, instrument + λεπτικός – to take, accept) method was used for determining quality indicators based on the analysis of sensory perception; sight, smell, hearing, touch, taste. The values of the indicators were determined by analysing the expert’s feelings based on his experience of assessment and, as a rule, were expressed in points or places of the samples on an imaginary scale. The advantages include the availability and speed of determining the quality indicators and no need for expensive equipment for measurements. Most people have sufficient sensory (sensitive) capabilities to organoleptically assess appearance, taste, smell, and texture. The disadvantages of organoleptic methods include the subjectivity of the assessment, the relative expression of its results in dimensionless quantities (colour - green, red, etc.; taste - sweet pronounced, mild, tasteless, etc.), incomparability, and insufficient reproducibility of the results. Each of these organoleptic methods is carried out with the help of certain human sensory organs, while the values of specific quality indicators are measured (Table 3).
Table 3) The relationship of organoleptic methods and quality indicators
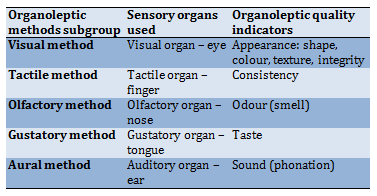
Visual method – a method based on the perception of the appearance and/or colour of an object with the help of sight. Appearance is a complex indicator that includes colour, odour, turbidity and is determined visually. With the help of sight, a person receives the most information (70-80%). Visual assessment is one of the most common and accessible ones.
With the Stennen font. A standard font is placed under a cylinder 60cm high and 3-3.5cm in diameter at a distance of 4cm from the bottom; the test sample is poured into the cylinder so that the font is readable, and the maximum height of the water column is determined. The method for the quantitative determination of transparency is based on determining the height of the water column, at which it is still possible to visually distinguish (read) a black font with a height of 3.5mm and a line width of 0.35mm on a white background, or see an adjustment mark (for example, a black cross on white paper). The method used is unified and complies with ISO 7027. The classification of water by transparency is given in Table 4.
Table 4) Water transparency assessment
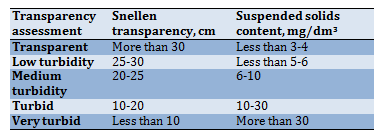
There is a relationship between the transparency by the cross, the transparency by the font and the content of suspended solids, which is presented in Table 4. However, the content of suspended solids by the transparency value can be estimated rather approximately since the latter also depends on the colour of substances dissolved in water.
The indicators determined by the potentiometric method are based on using the electromotive force of the electrochemical (potentiometric) cell of the analyte concentration in the analysed solution. The simplest potentiometric cell contains two electrodes; the potential of one of them directly or indirectly depends on the concentration of the substance being determined - it is called an indicating (ion-selective) electrode; and a second electrode concerning which the potential of the indicating electrode is measured, called a reference electrode.
The potentiometric analysis provides the ability to directly and selectively determine different elements and different ionic forms of the same element (NH4+, NO2-, NO3-, S-2, SO4-2, Cl-), which is of particular importance for environmental analysis. The method’s advantages are simplicity, speed, low cost of equipment, the ability to analyse turbid and coloured media.
Determination of water salinity is carried out by calculation method as the total concentration of anions, cations and non-dissociated inorganic substances in water, expressed in g/dm3 (Table 5).
Table 5) Classification of mineral waters by salinity
Conductivity is used to estimate the total solids dissolved in water. Conductometry is based on the numerical indicator of this physical quantity. Considering specifically water, which is a solution of a mixture of strong and weak electrolytes: the mineral part of the water is made up of sodium, potassium, calcium, chlorine, sulphate (SO42-), bicarbonate ions, it can be concluded that these ions determine the electrical conductivity of water.
The colour of the water is determined photometrically - by comparing samples of the test liquid with solutions that imitate the colour of natural water. The following equipment, materials, reagents are used for testing: colour density meter with a blue light filter; sample cells with a thickness of the light-absorbing layer of 5-10 cm; volumetric flasks in accordance with GOST 1770, with a capacity of 1000 cm3; measuring pipettes according to GOST 29227, with a capacity of 1, 5, 10 cm with divisions of 0.1 cm; Nessler tubes with a capacity of 100 cm; potassium dichromate according to GOST 4220; cobalt sulphate according to GOST 4462; sulphuric acid according to GOST 4204, with a density of 1.84 g/cm; distilled water in accordance with GOST 6709; membrane filters No. 4 [3; 4]. All reagents used in the analysis must be of the analytical-reagent grade.
Test preparation:
1. Preparation of the standard solution (solution No. 1): 0.0875 g of potassium dichromate (KCrO), 2.0 g of cobalt sulphate (CoSO·7HO) and 1 ml of sulfuric acid (density 1.84 g/cm) are dissolved in distilled water and the volume of the solution is brought to 1 dm3. The solution corresponds to a colour of 500°.
2. Preparation of a dilute sulphuric acid solution (solution No. 2): 1 cm3 of concentrated sulphuric acid with a density of 1.84 g/cm3 is brought to 1 dm3 with distilled water.
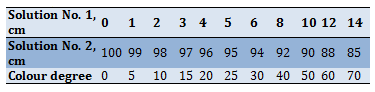
3. Preparation of the colourimetric scale. To prepare the colourimetric scale, a set of Nessler tubes with a capacity of 100 cm is used. In each cylinder, solution No. 1 and solution No. 2 are mixed in the ratio indicated on the colourimetric scale (Table 6). The solution in each tube corresponds to a certain degree of colour. The colourimetric scale is stored in a dark place. It is replaced every 2-3 months [9].
Table 6) Colour grade
4. Construction of a calibration curve. A calibration graph is plotted on a colourimetric scale. The obtained values of optical densities and the corresponding degrees of colour are plotted on the graph.
Testing. In a Nessler tube, 100 cm of the test water, filtered through a membrane filter, is measured and compared with the colourimetric scale, viewing from above on a white background. If the test water sample has a colour of more than 70°, the sample should be diluted with distilled water in a certain ratio until the colour of the test water is comparable to the colour of the scale. The result is multiplied by the number corresponding to the dilution.
When determining the chromaticity using a photocolorimeter, sample cells with a thickness of the light-absorbing layer of 5-10 cm are used. The control liquid is distilled water, from which suspended substances are removed by filtration through membrane filters No. 4. The optical density of the filtrate of the test water sample is measured in the blue part of the spectrum with a light filter at = 413 nm. The colour is determined by a grading schedule and is expressed in degrees of colour. Organoleptic methods determine the nature and intensity of the odour.
Testing: the nature of the water odour is determined at 20°C by the smell. In a flask with a ground plug with a capacity of 250-350 cm3, 100 cm3 of test water at a temperature of 20°C is measured. The flask is closed with a plug, the contents of the flask are stirred several times with rotary movements, after which the flask is opened and the nature and intensity of the smell is determined.
Determination of odour at 60°C: 100 cm3 of test water is poured into a flask. The neck of the flask is closed with a watch glass and heated in a water bath to 50-60°C. The contents of the flask are mixed several times with rotary movements. Moving the glass to the side, the nature and intensity of the odour is determined. The intensity of the water odour is determined at 20 and 60°C and is assessed using a five-point system. For example: at 20°C first tap (Volga river) – no odour – 0 points, at 60°C first tap (Volga river) – earthy odour – 1 point; second tap (filtered reservoir) – chlorine odour – 1 point; 2 taps (filtered reservoir) – chlorine reservoir – 2 points.
The Snellen transparency of the wastewater, according to the method [1], is determined with the Snellen cylinder. The test water is thoroughly mixed (shaken) and poured into a cylinder, under which a text printed in Snellen's font on white paper is placed at a distance of 4 cm from the bottom of the cylinder (Figure 1). The excess water is drained off with a tap or a tube while stirring continuously with a glass rod until the text is readable. The height of the liquid column is read off the scale applied to the cylinder with an accuracy of 0.5cm.
The scientific sanitary assessment of water is one of the most difficult problems of sanitary examination. Snellen font for measuring water transparency [10]. The result is expressed in centimetres as the arithmetic means of the two definitions. The "cross transparency" is determined using a white plate with two crossed black lines 1 mm in thickness. This method is used to control the operation of treatment facilities. In thermal power engineering, the most often used is "font transparency (by Snellen)", equal to the height of the water column, through which the standard typographic font with a letter height of 3.5 mm is still readable.

Figure 1) Snellen transparency method
Equipment and reagents: burette 25 cm3, stand, ammonium buffer mixture (NH4OH + NH4Cl) with pH 8-9, complexone ΙΙΙ (Trilon B) 0.1 N, indicator eriochrome black (sugar mixture of 1 g indicator + 99 g sodium chloride), conical flasks with a capacity of 250 cm3, measuring cylinders for 100 cm3, 10 cm3. The sequence of procedures: a 100 cm3 sample is placed in a conical flask, 10 cm3 of an ammonium buffer mixture, 10-20 mg of an indicator are poured into a small cylinder, stirred and titrated with a Trilon B solution until the colour of the solution changes from wine red to blue. The total stiffness is calculated using the formula (Eq. 1):
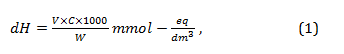
where: V – the volume of 0.1 N Trilon B solution used for titration, C – concentration of Trilon B solution, W – aliquot part of the sample.
There are several methods for determining the pH value of solutions. The pH is roughly estimated using indicators, accurately measured with a pH meter, or determined analytically, by conducting an acid-base titration:
Show cover is a key element in monitoring and forecasting flood conditions since precipitation shows feed surface and groundwater, which largely depends on the distribution of show cover, its physical properties, and the nature of show melting—influencing the temperature and water regime. Influencing the regime of soils, the show cover itself becomes a powerful climate-forming factor [1-5].
Norilsk is located north of the Krasnoyarsk Krai and is the district’s administrative centre. The region is a zone of permafrost rocks, whose thickness is 40-80 m. It is one of the coldest cities in the world. It is much colder than Murmansk, even though both cities are located almost at the same latitude. Norilsk is located 300 km north of the Arctic Circle, 2400 km from the North Pole, and 1500 km to the capital of the Krasnoyarsk Krai. It is considered that Norilsk ranks second in pollution of air, into which enterprises annually emit large amounts of sulphur dioxide, phenols, and heavy metal particles. The cold and long winter with January temperatures of -40⁰C is exacerbated by very strong winds. The period of severe cold lasts about 280 days, from mid-September to early May, of which blizzards accompany 130 days. The summer period begins at the end of June and lasts until the end of August. On average, the frost-free period lasts 84 days, and sometimes its duration is reduced to 53 days. The relative humidity is 76%. The snow cover can lie from 244 to 277 days.
Snow is a good sorbing agent. Therefore, it imbibes solid and gaseous pollutants from the atmosphere. It is possible to judge air pollution from enterprises and transport emissions by the state of the snow cover. During the thawing period, pollutants contained in the snow cover enter the soil and water bodies, causing environmental damage.
It was established that zinc determines the total show cover contamination index, as well as in the case of soil. A high positive correlation was found between the coefficient of zinc concentration in the show cover and soil, which may indicate a constant supply of this pollution index. Winter flux is an important assessment element when estimating the annual carbon budget on a regional and global scale. The scientific sanitary assessment of water is one of the most difficult problems of sanitary examination. Snellen font for measuring water transparency [5-10].
Colour is a natural property of meltwater due to humic substances formed when organic compounds are destroyed in the soil, are washed out of it, and give snow and meltwater a colour from yellowish to brown. The colour of meltwater can be imparted by iron compounds (yellow-greenish colouration), flowering algae, suspended solids, sewage pollution, etc. The colour of meltwater is determined photometrically; it should not be higher than 20°, then the water is considered colourless.
Pure snow is odourless. It should be borne in mind that the smell can appear in the meltwater due to contamination with organic and inorganic impurities. The nature and intensity of the odour are determined by the perceived smell. There are two groups of odours: natural and artificial odours. The intensity of the liquid odour is assessed using a 5-point system, presented in Table 1. The smell of water should not exceed 2 points.
Table 1) Odour intensity assessment
Transparency is a water quality indicator that simplifies and quickly controls suspended solids' content and colloidal impurities. The measure of transparency is the height of the water column through which the control object can still be observed. Depending on the type of this object, it is customary to distinguish between several types of transparency. When observing a white (usually porcelain) board or disc with a diameter of 20 cm, the "transparency over the disc" is determined. This value is measured only for waters of surface water bodies (rivers, lakes, reservoirs). Transparency (turbidity) depends on the presence of suspended solids of mineral or organic origin in the meltwater; increased turbidity indicates its contamination with solid particles from the air.
Hydrogen ion exponent (pH) - characterises the concentration of free hydrogen ions in water and expresses the degree of acidity or alkalinity of water (the ratio of H+ and OH- ions in water formed during the water dissociation) and is quantitatively determined by the concentration of hydrogen ions pH = - Ig [H+]. The pH value in river waters usually varies within 6.5-8.5, in atmospheric precipitation 4.6-6.1, in swamps 5.5-6.0, in sea waters 7.9-8.3. By the requirements for the composition and properties of water in reservoirs near drinking water points, water bodies in recreational areas, as well as water in fishery water bodies, the pH value should not go beyond the 6.5-8.5 range.
Salinity (total mineralisation) is a quantitative indicator of the content of substances dissolved in water. It is also called the total salt content since the substances dissolved in water are salts. The most common inorganic salts (bicarbonates, chlorides, and sulphates of calcium, magnesium, potassium, and sodium) and a small amount of organic matter soluble in water. The total mineralisation is confused with the dry residue. These parameters are very close, but the methods for determining them are different. When determining the dry residue, more volatile organic compounds dissolved in water are not considered. As a result, the total salinity and dry matter may differ by these volatile compounds (usually no more than 10%). The salinity level in drinking water is due to water quality in natural sources (which vary significantly in different geological regions due to the different solubility of minerals; Table 2).
In addition to factors caused by nature, anthropogenic factors greatly influence the general mineralisation of water: industrial wastewater, urban stormwater runoff (salt is used in winter as a de-icing agent), etc. According to the World Health Organisation, there is no reliable information on the health effects of high salt content.
Table 2) Categories of water salinity
For medical reasons, the WHO does not impose restrictions. As a rule, water taste is considered normal with a total mineralisation of up to 600mg/L, with a salt content of more than 1000-1200mg/L; water can cause complaints from consumers; in this regard, WHO recommends a limit for total mineralisation of 1000mg/L for organoleptic indications. This level may vary depending on prevailing habits and local conditions. People consume low salt content in developed countries - water purified by reverse osmosis technology. Such water is the purest and most harmless; it is widely used in the food industry, bottled water, etc. See: “Water and mineral matter” for more information on minerals and water. A separate topic is the value of mineralisation during the scaling and precipitation in the heating, boiler, and plumbing equipment. In this case, special requirements apply to the water, and the lower the level of mineralisation (especially the content of hardness salts), the better.
The presence of ferrous and ferric iron, manganese, aluminium, nitrate, etc., does not seriously affect electrical conductivity (unless, of course, these ions are contained in water in significant quantities). Electrical conductivity is not standardised, but a value of 2000μS/cm roughly corresponds to the total mineralisation of 1000mg/L. As already noted, the electrical conductivity changes with temperature, leading to measurement errors. With the help of electrical conductivity, it is possible to indirectly estimate the electrochemical composition of water and compare it with the parameters of the favourable environment for the development of living organisms. Conductometers are devices for measuring resistivity or conductivity used to monitor the quality of water, condensate or steam. The main purpose of conductometers is to analyse the properties and quality of water its suitability for economical use.
Hypothesis: the snow cover accumulates pollutants found in dust-gas emissions from industrial enterprises and vehicle exhaust gases. Therefore, this study aims to analyse the snow cover in the Norilsk industrial region and assess the state of atmospheric air in the winter. To achieve this goal, it is necessary to solve the following tasks: conduct a literature review on a given topic; take samples of snow in various industrial districts of Norilsk (IDN) (from the streets and near the roadsides); study the dependence of the qualitative characteristics of snow on the sampling site; conclude the quality of snow cover in different areas of the IDN. Stages of research:
1. Conducting a literature review.
2. Preparing an experiment programme.
3. Snow sampling.
4. Preparation of reagents and equipment for the experiment.
5. Carrying out an experiment.
6. Processing of the received data and plotting of dependency diagrams.
7. Preparing a written report on the results of research work.
Materials and Methods
This experimental study was conducted in 2019. The organoleptic (ancient Greek: ὄργανον – tool, instrument + λεπτικός – to take, accept) method was used for determining quality indicators based on the analysis of sensory perception; sight, smell, hearing, touch, taste. The values of the indicators were determined by analysing the expert’s feelings based on his experience of assessment and, as a rule, were expressed in points or places of the samples on an imaginary scale. The advantages include the availability and speed of determining the quality indicators and no need for expensive equipment for measurements. Most people have sufficient sensory (sensitive) capabilities to organoleptically assess appearance, taste, smell, and texture. The disadvantages of organoleptic methods include the subjectivity of the assessment, the relative expression of its results in dimensionless quantities (colour - green, red, etc.; taste - sweet pronounced, mild, tasteless, etc.), incomparability, and insufficient reproducibility of the results. Each of these organoleptic methods is carried out with the help of certain human sensory organs, while the values of specific quality indicators are measured (Table 3).
Table 3) The relationship of organoleptic methods and quality indicators
Visual method – a method based on the perception of the appearance and/or colour of an object with the help of sight. Appearance is a complex indicator that includes colour, odour, turbidity and is determined visually. With the help of sight, a person receives the most information (70-80%). Visual assessment is one of the most common and accessible ones.
With the Stennen font. A standard font is placed under a cylinder 60cm high and 3-3.5cm in diameter at a distance of 4cm from the bottom; the test sample is poured into the cylinder so that the font is readable, and the maximum height of the water column is determined. The method for the quantitative determination of transparency is based on determining the height of the water column, at which it is still possible to visually distinguish (read) a black font with a height of 3.5mm and a line width of 0.35mm on a white background, or see an adjustment mark (for example, a black cross on white paper). The method used is unified and complies with ISO 7027. The classification of water by transparency is given in Table 4.
Table 4) Water transparency assessment
There is a relationship between the transparency by the cross, the transparency by the font and the content of suspended solids, which is presented in Table 4. However, the content of suspended solids by the transparency value can be estimated rather approximately since the latter also depends on the colour of substances dissolved in water.
The indicators determined by the potentiometric method are based on using the electromotive force of the electrochemical (potentiometric) cell of the analyte concentration in the analysed solution. The simplest potentiometric cell contains two electrodes; the potential of one of them directly or indirectly depends on the concentration of the substance being determined - it is called an indicating (ion-selective) electrode; and a second electrode concerning which the potential of the indicating electrode is measured, called a reference electrode.
The potentiometric analysis provides the ability to directly and selectively determine different elements and different ionic forms of the same element (NH4+, NO2-, NO3-, S-2, SO4-2, Cl-), which is of particular importance for environmental analysis. The method’s advantages are simplicity, speed, low cost of equipment, the ability to analyse turbid and coloured media.
Determination of water salinity is carried out by calculation method as the total concentration of anions, cations and non-dissociated inorganic substances in water, expressed in g/dm3 (Table 5).
Table 5) Classification of mineral waters by salinity
Conductivity is used to estimate the total solids dissolved in water. Conductometry is based on the numerical indicator of this physical quantity. Considering specifically water, which is a solution of a mixture of strong and weak electrolytes: the mineral part of the water is made up of sodium, potassium, calcium, chlorine, sulphate (SO42-), bicarbonate ions, it can be concluded that these ions determine the electrical conductivity of water.
The colour of the water is determined photometrically - by comparing samples of the test liquid with solutions that imitate the colour of natural water. The following equipment, materials, reagents are used for testing: colour density meter with a blue light filter; sample cells with a thickness of the light-absorbing layer of 5-10 cm; volumetric flasks in accordance with GOST 1770, with a capacity of 1000 cm3; measuring pipettes according to GOST 29227, with a capacity of 1, 5, 10 cm with divisions of 0.1 cm; Nessler tubes with a capacity of 100 cm; potassium dichromate according to GOST 4220; cobalt sulphate according to GOST 4462; sulphuric acid according to GOST 4204, with a density of 1.84 g/cm; distilled water in accordance with GOST 6709; membrane filters No. 4 [3; 4]. All reagents used in the analysis must be of the analytical-reagent grade.
Test preparation:
1. Preparation of the standard solution (solution No. 1): 0.0875 g of potassium dichromate (KCrO), 2.0 g of cobalt sulphate (CoSO·7HO) and 1 ml of sulfuric acid (density 1.84 g/cm) are dissolved in distilled water and the volume of the solution is brought to 1 dm3. The solution corresponds to a colour of 500°.
2. Preparation of a dilute sulphuric acid solution (solution No. 2): 1 cm3 of concentrated sulphuric acid with a density of 1.84 g/cm3 is brought to 1 dm3 with distilled water.
3. Preparation of the colourimetric scale. To prepare the colourimetric scale, a set of Nessler tubes with a capacity of 100 cm is used. In each cylinder, solution No. 1 and solution No. 2 are mixed in the ratio indicated on the colourimetric scale (Table 6). The solution in each tube corresponds to a certain degree of colour. The colourimetric scale is stored in a dark place. It is replaced every 2-3 months [9].
Table 6) Colour grade
4. Construction of a calibration curve. A calibration graph is plotted on a colourimetric scale. The obtained values of optical densities and the corresponding degrees of colour are plotted on the graph.
Testing. In a Nessler tube, 100 cm of the test water, filtered through a membrane filter, is measured and compared with the colourimetric scale, viewing from above on a white background. If the test water sample has a colour of more than 70°, the sample should be diluted with distilled water in a certain ratio until the colour of the test water is comparable to the colour of the scale. The result is multiplied by the number corresponding to the dilution.
When determining the chromaticity using a photocolorimeter, sample cells with a thickness of the light-absorbing layer of 5-10 cm are used. The control liquid is distilled water, from which suspended substances are removed by filtration through membrane filters No. 4. The optical density of the filtrate of the test water sample is measured in the blue part of the spectrum with a light filter at = 413 nm. The colour is determined by a grading schedule and is expressed in degrees of colour. Organoleptic methods determine the nature and intensity of the odour.
Testing: the nature of the water odour is determined at 20°C by the smell. In a flask with a ground plug with a capacity of 250-350 cm3, 100 cm3 of test water at a temperature of 20°C is measured. The flask is closed with a plug, the contents of the flask are stirred several times with rotary movements, after which the flask is opened and the nature and intensity of the smell is determined.
Determination of odour at 60°C: 100 cm3 of test water is poured into a flask. The neck of the flask is closed with a watch glass and heated in a water bath to 50-60°C. The contents of the flask are mixed several times with rotary movements. Moving the glass to the side, the nature and intensity of the odour is determined. The intensity of the water odour is determined at 20 and 60°C and is assessed using a five-point system. For example: at 20°C first tap (Volga river) – no odour – 0 points, at 60°C first tap (Volga river) – earthy odour – 1 point; second tap (filtered reservoir) – chlorine odour – 1 point; 2 taps (filtered reservoir) – chlorine reservoir – 2 points.
The Snellen transparency of the wastewater, according to the method [1], is determined with the Snellen cylinder. The test water is thoroughly mixed (shaken) and poured into a cylinder, under which a text printed in Snellen's font on white paper is placed at a distance of 4 cm from the bottom of the cylinder (Figure 1). The excess water is drained off with a tap or a tube while stirring continuously with a glass rod until the text is readable. The height of the liquid column is read off the scale applied to the cylinder with an accuracy of 0.5cm.
The scientific sanitary assessment of water is one of the most difficult problems of sanitary examination. Snellen font for measuring water transparency [10]. The result is expressed in centimetres as the arithmetic means of the two definitions. The "cross transparency" is determined using a white plate with two crossed black lines 1 mm in thickness. This method is used to control the operation of treatment facilities. In thermal power engineering, the most often used is "font transparency (by Snellen)", equal to the height of the water column, through which the standard typographic font with a letter height of 3.5 mm is still readable.
Figure 1) Snellen transparency method
Equipment and reagents: burette 25 cm3, stand, ammonium buffer mixture (NH4OH + NH4Cl) with pH 8-9, complexone ΙΙΙ (Trilon B) 0.1 N, indicator eriochrome black (sugar mixture of 1 g indicator + 99 g sodium chloride), conical flasks with a capacity of 250 cm3, measuring cylinders for 100 cm3, 10 cm3. The sequence of procedures: a 100 cm3 sample is placed in a conical flask, 10 cm3 of an ammonium buffer mixture, 10-20 mg of an indicator are poured into a small cylinder, stirred and titrated with a Trilon B solution until the colour of the solution changes from wine red to blue. The total stiffness is calculated using the formula (Eq. 1):
where: V – the volume of 0.1 N Trilon B solution used for titration, C – concentration of Trilon B solution, W – aliquot part of the sample.
There are several methods for determining the pH value of solutions. The pH is roughly estimated using indicators, accurately measured with a pH meter, or determined analytically, by conducting an acid-base titration:
- For a rough estimate of hydrogen ions concentration, acid-base indicators are often used – organic dye substances, the colour of which depends on the pH of the medium. The most popular indicators: litmus, phenolphthalein, methyl orange, etc. Indicators can be in 2 differently coloured forms – either acidic or basic. The colour change of all indicators occurs in their acidity range, often 1-2 units.
- To increase the working range of pH measurement, a universal indicator is used, which is a mixture of several indicators. The universal indicator sequentially changes colour from red through yellow, green, blue to violet when passing from an acidic region to an alkaline one. Determination of pH by the indicator method is difficult for turbid or coloured solutions.
- The use of a special device – a pH meter – makes it possible to measure pH in a wider range and more accurately (up to 0.01 pH units) than using indicators. The ionometric method for determining pH is based on measuring a galvanic circuit with a millivoltmeter-ionometer, which includes a glass electrode, the potential of which depends on the concentration of H+ ions in the surrounding solution. The method has high accuracy and convenience, especially after calibration of the indicator electrode in the selected pH range, which makes it possible to measure the pH of turbid and coloured solutions and therefore is often used [11; 12].
The electrometric method for determining salinity is based on measuring the relative electrical conductivity of water using a special device - a conductometer, which makes it possible to accelerate and increase the accuracy of its determination in comparison with other methods.
The operating principle of the conductometer is based on the direct dependence of the electrical conductivity of water (current strength in a constant electric field created by the electrodes of the device) on the number of compounds dissolved in water. A wide range of relevant equipment now allows measuring the conductivity of almost any water, from ultraclean (very low conductivity) to saturated with chemical compounds (high conductivity) [13-15].
Equipment and reagents: conductometer T.D.S hoa ld, a beaker with a capacity of 25 cm3. The sequence of procedures: the active conductometer is placed in the glass with the test sample, after the sound signal the result is written into the table. The method for determining suspended solids is based on separating them from a sample by filtering water through a pre-weighed dried paper or membrane filter and determining the mass of the filter cake dried to constant weight at (105 ± 2)°C.
The determination of Pb2+/ ions is as follows: the test meltwater is placed in a test tube to a height of 1-2 cm and 1 cm3 of sodium sulphide (Na2S) solution of concentration is added (Eq. 2):

The determination of Fe+2 ions is as follows (Eq. 3):

Reactions of the iron (II) cation Fe2+: solutions of Fe2+ salts are coloured in pale green. Potassium hexacyanoferrate (III) K3[Fe(CN)6] with Fe2+ ion gives dark blue precipitate (Eq. 4):
Add 2-3 drops of Fe2+ salt solution to 1-2 drops of K3[Fe(CN)6] solution. The reaction is sensitive and is most often used to detect Fe2+.
The determination of Fe+3 ions is as follows: ammonium thiocyanates NH4SCN or potassium KSCN form with Fe3+ a thiocyanate complex [Fe(SCN)]2+, which stains the solution in blood-red colour (Eq. 5):

With an excess of reagent, the equilibrium of this reversible reaction shifts to the right, and the colour of the solution intensifies. Along with this, according to A.K. Babko, a number of complexions with sthe ame colour are formed (Eq. 6):
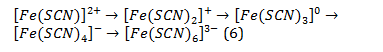
The reaction is carried out either in a test tube or by the drop method.
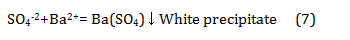
Determination of SO4-2 ions (Eq. 7):
Determination of Ni2+ ions (with dimethylglyoxime) (Eq. 8):

L.A. Chugaev's reaction. Dimethylglyoxime [CH3CNOH]2 extricates Ni2+ from solutions in the form of a crystalline scarlet-red precipitate of the intracomplex salt. 2-3 drops of nickel salt Ni2+ is added to 3-5 drops of NH4OH and 2-3 drops of 1% alcohol solution of dimethylglyoxime precipitate a pink-red complex precipitate (Eq. 9):
This is the most characteristic and sensitive reaction to the Ni2+ ion. All solutions except dimethylglyoxime should be taken as 2H.
Drip method. The reaction can be carried out dropwise on filter paper. To do this, a drop of nickel (II) salt solution is applied to a sheet of filter paper, then a drop of an alcohol solution of dimethylglyoxime. The paper is held over a bottle with a concentrated ammonia solution (in ammonia vapour) until a pink-red spot appears [16-25].
Findings
The subject of the study: snow sampled from different streets of Norilsk - 50 Let Oktyabrya, Talnakhskaya, Kirova, Komsomolskaya, Kotulskogo Passway, Metalurgov Square. Study of the impact on the ecological state of snow cover:
The operating principle of the conductometer is based on the direct dependence of the electrical conductivity of water (current strength in a constant electric field created by the electrodes of the device) on the number of compounds dissolved in water. A wide range of relevant equipment now allows measuring the conductivity of almost any water, from ultraclean (very low conductivity) to saturated with chemical compounds (high conductivity) [13-15].
Equipment and reagents: conductometer T.D.S hoa ld, a beaker with a capacity of 25 cm3. The sequence of procedures: the active conductometer is placed in the glass with the test sample, after the sound signal the result is written into the table. The method for determining suspended solids is based on separating them from a sample by filtering water through a pre-weighed dried paper or membrane filter and determining the mass of the filter cake dried to constant weight at (105 ± 2)°C.
The determination of Pb2+/ ions is as follows: the test meltwater is placed in a test tube to a height of 1-2 cm and 1 cm3 of sodium sulphide (Na2S) solution of concentration is added (Eq. 2):
The determination of Fe+2 ions is as follows (Eq. 3):
Reactions of the iron (II) cation Fe2+: solutions of Fe2+ salts are coloured in pale green. Potassium hexacyanoferrate (III) K3[Fe(CN)6] with Fe2+ ion gives dark blue precipitate (Eq. 4):
Add 2-3 drops of Fe2+ salt solution to 1-2 drops of K3[Fe(CN)6] solution. The reaction is sensitive and is most often used to detect Fe2+.
The determination of Fe+3 ions is as follows: ammonium thiocyanates NH4SCN or potassium KSCN form with Fe3+ a thiocyanate complex [Fe(SCN)]2+, which stains the solution in blood-red colour (Eq. 5):
With an excess of reagent, the equilibrium of this reversible reaction shifts to the right, and the colour of the solution intensifies. Along with this, according to A.K. Babko, a number of complexions with sthe ame colour are formed (Eq. 6):
The reaction is carried out either in a test tube or by the drop method.
Determination of SO4-2 ions (Eq. 7):
Determination of Ni2+ ions (with dimethylglyoxime) (Eq. 8):
L.A. Chugaev's reaction. Dimethylglyoxime [CH3CNOH]2 extricates Ni2+ from solutions in the form of a crystalline scarlet-red precipitate of the intracomplex salt. 2-3 drops of nickel salt Ni2+ is added to 3-5 drops of NH4OH and 2-3 drops of 1% alcohol solution of dimethylglyoxime precipitate a pink-red complex precipitate (Eq. 9):
This is the most characteristic and sensitive reaction to the Ni2+ ion. All solutions except dimethylglyoxime should be taken as 2H.
Drip method. The reaction can be carried out dropwise on filter paper. To do this, a drop of nickel (II) salt solution is applied to a sheet of filter paper, then a drop of an alcohol solution of dimethylglyoxime. The paper is held over a bottle with a concentrated ammonia solution (in ammonia vapour) until a pink-red spot appears [16-25].
Findings
The subject of the study: snow sampled from different streets of Norilsk - 50 Let Oktyabrya, Talnakhskaya, Kirova, Komsomolskaya, Kotulskogo Passway, Metalurgov Square. Study of the impact on the ecological state of snow cover:
- industrial emissions – samples were taken near apartment buildings in the city of Norilsk;
- transport – samples were taken near the road (on the dividing strip) and on the streets.
The work was carried out in the spring (March-April). The average daily temperature in the city of Norilsk in March ranged from -15 to 0 (Figure 2). The average daily temperature in the city of Norilsk in April ranged from -22 to -3 (Figure 3).
The most frequent wind directions in March are south - 40.4% and southeast - 30.9%. The most frequent wind directions in April are south - 27.4% west - 19.8% and south-west - 14.2. Information about the wind rose from May 2018 to April 2019 is given in Appendix 1. From Table 7 it can be seen that the meltwater of the snow cover sampled from different streets of the Tsentralny district of Norilsk city is odourless and colourless.
The meltwater of the snow sampled on the Talnakhskaya and Kirova streets has a high value of the "Transparency" indicator and approaches the value of distilled water to 300 cm. A high "Transparency" indicator is noted in the meltwater of the snow sampled on all streets. The "Transparency" indicator is in good agreement with the appearance of the sampled snow. The meltwater of the snow taken from the road contained slag particles of various sizes, as well as many fine particles, which increased the turbidity.
The pH of the meltwater has a value close to neutral and ranges from 7.1 to 8.6, with the exception of meltwater from the snow sampled from the roadways of 50 Let Oktyabrya, Kirova streets and Kotulskogo Passway (Table 8). Since the main salts that determine the salt content are calcium and magnesium bicarbonates, at a hardness of less than 0.1mMol/L, the pH value from 8 to 9 is explained by the hydrolysis of these salts.
The meltwater from all samples is very soft: the hardness is less than 0.1mmol/L, this is explained by the freezing of the already soft water. Because in any water hardness ions (Ca+2, Mg+2) bind with anions (HCO3-), then in very soft water the alkalinity caused by these anions is less than the detection threshold and is conventionally assumed to be zero.
The total salinity of meltwater, depending on the place of sampling, is shown in Figure 11: 1. Distilled water; 2. 50 Let Oktyabrya (street); 3. 50 Let Oktyabrya (roadside); 4. Talnakhskaya (street, near NTEK); 5. Talnakhskaya, 10 (near Arbat shop); 6. Kirova (Lyceum No. 40); 7. Kirova, 5; 8. Komsomolskaya (street); 9. Komsomolskaya (roadside); 10. Kotulskogo 15 (street); 11. Kotulskogo, 5 (roadside); 12. Metalurgov Square (street), 13. Metalurgov Square (roadside).
It can be seen from the graph (Figure 4) that the total salt content in the samples taken on the roadside is slightly higher than in the samples taken near apartment buildings. The highest salt content was noted in the sample taken at the Metallurgov Square near the road and on the street. The same samples showed a hardness of 0.8mMol/L and alkalinity of 1.2mMol/L. This can be explained by the fact that a significant amount of freshly fallen snow fell into the sample, which corresponds in composition to natural water (Table 9).
Since the Tsentralny District of Norilsk is located in close proximity to the industrial enterprises of the metallurgical production and machine-building factories, it could be expected that the snow would be contaminated with heavy metal ions and sulphate ions. From Table 9 it can be seen that the pollution of the snow cover with heavy metal ions was not observed. In all samples, their content was less than the threshold of sensitivity of qualitative reactions, i.e. less than 0.1mg/L. The sulphate ion is formed from sulphur-containing gases under the influence of atmospheric oxygen and moisture contained in the air by the reaction (Eq. 10):
No sulphate ion was found in the samples under study. This may indicate that the sulphur-containing gases of metallurgical production practically did not get into the residential zone of the Tsentralny District of Norilsk.
This is confirmed by meteorological data (Appendix 1): in the period from October to April, the main wind direction is south, south-west or south-east, and metallurgical enterprises are located in the north-west of the urban area. Thus, the main contaminant of snow cover is solid slag particles, which are sprinkled on roads and sidewalks to improve vehicle traction and prevent pedestrian injury. Cars, when driving, throw off slag particles to the side of the road and thereby pollute the snow cover, the pollution of snow with solid particles depends on the number of vehicles passing along this section of the road. The dependence of the presence of solid particles in the meltwater on the number of cars passing through the road section per hour is shown in Figure 5.

Figure 2) Average daily temperature in Norilsk in March
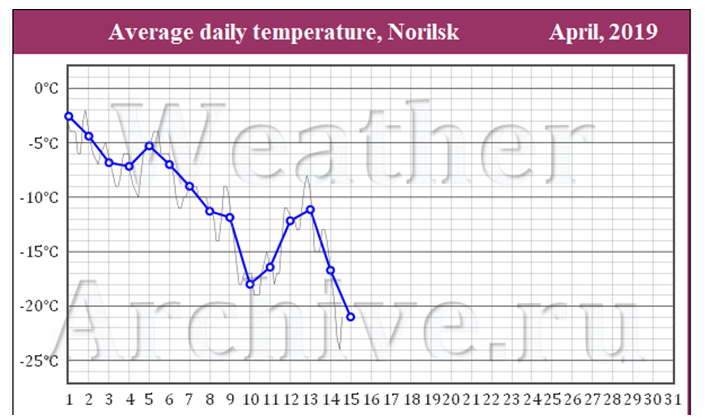
Figure 3) Average daily temperature in Norilsk in April
Table 7) Organoleptic indicators

Table 8) Qualitative indicators of the state of the snow cover
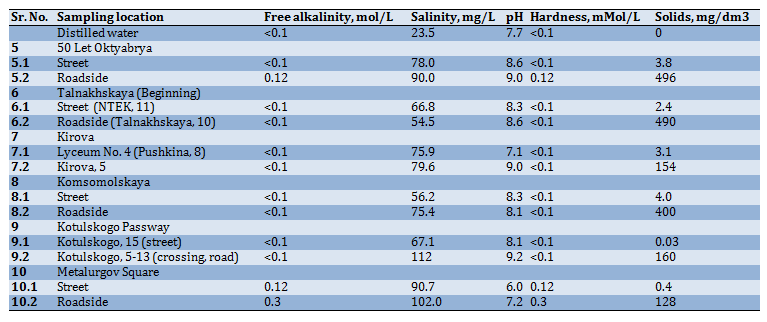
Table 9) Content of non-ferrous metal ions and sulphate ion
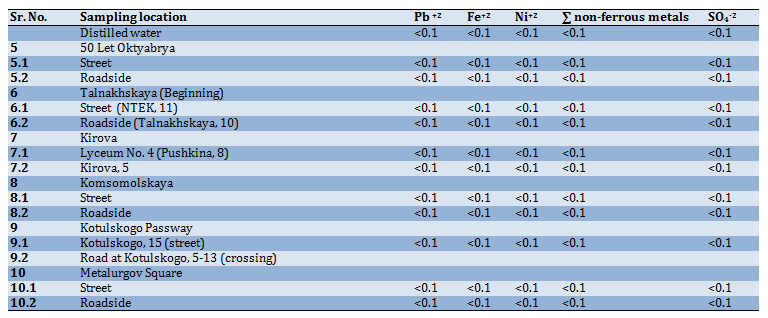
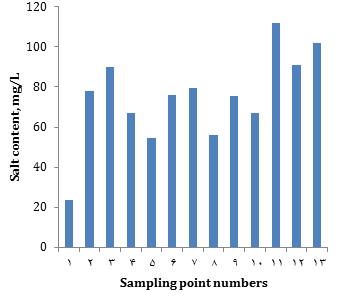
Figure 4) Dependence of the total salt content on the sampling site
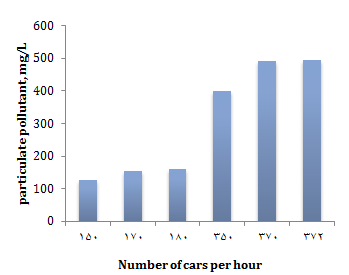
Figure 5) Dependence of solids content on the number of passing cars
Discussion
Scientists highlight the importance of snow-related studies and methods for converting snow depth to the water equivalent of snow [7-10, 14-25]. Nayak et al. [23] considered the problem of global warming, in particular, its impact on water resources and ecosystems in the context of the snowmelt process. Their research significantly impacts the decision-making process for reservoir and water management strategies. It states the necessity of complex investigations of global warming and climate-changing problems including the evaluation of the seasonal snow cover.
Bormann et al. [22] paid their attention to snow densification. Their method for predicting spring snow density from climate data was implemented in practice while the authors managed to calculate values related to snow density in the United States, Australia and the former Soviet :union:. While discussing the spatial snow distribution within the Berchtesgaden National Park area, Bernhardt et al. [25] substantiated the need to accurately predict snow distribution and analysed processes associated with snow redistribution and melt-water generation. This study allowed us to make conclusions regarding the specifics of runoff routing, probability and scales of possible floods. The researcher proved that their model should be implemented and analysed within other territorial areas [25]. Schöber et al. [24] developed a method for estimating snow bulk density that can be useful for fieldwork and hydrological and glaciological studies.
Chemically pure water which completely lacks taste and smell does not occur in nature. Soluble substances can change some properties of water including smell and taste. Sources of smell and taste can be of natural and artificial origin, including rotting plants, fungi and mould, bacteria, heavy metal compounds, industrial waste, chlorophenolic compounds, etc. [7, 12, 24]. Since these sources can negatively affect water quality, standards for its assessment have been developed [1, 3, 4].
Conclusion
The pH of the meltwater of the snow cover is close to neutral and is equal to 6.0-9.0. Salinity is caused by the presence of ions (Ca+2, Mg+2, HCO3-). Ions of heavy metals and sulphate ions were not detected in the melting snow, thus, no pollution with industrial gases in the residential area was noted. The main contamination with solid particles is due to the slagging of roads to improve the vehicle traction on the road surface.
Acknowledgements: There is nothing to be declared.
Ethical Permissions: There is nothing to be declared.
Conflicts of Interests: There is nothing to be declared.
Authors’ Contribution: Karmanovskaya N.V. (First Author), Introduction Writer/Main Researcher/Discussion Writer (34%); Nosova O.V. (Second Author), Assistant Researcher, Methodologist (33%); Kaverzin A.V. (Third Author), Statistical Analyst (33%).
Funding/Support: There is nothing to be declared.
The most frequent wind directions in March are south - 40.4% and southeast - 30.9%. The most frequent wind directions in April are south - 27.4% west - 19.8% and south-west - 14.2. Information about the wind rose from May 2018 to April 2019 is given in Appendix 1. From Table 7 it can be seen that the meltwater of the snow cover sampled from different streets of the Tsentralny district of Norilsk city is odourless and colourless.
The meltwater of the snow sampled on the Talnakhskaya and Kirova streets has a high value of the "Transparency" indicator and approaches the value of distilled water to 300 cm. A high "Transparency" indicator is noted in the meltwater of the snow sampled on all streets. The "Transparency" indicator is in good agreement with the appearance of the sampled snow. The meltwater of the snow taken from the road contained slag particles of various sizes, as well as many fine particles, which increased the turbidity.
The pH of the meltwater has a value close to neutral and ranges from 7.1 to 8.6, with the exception of meltwater from the snow sampled from the roadways of 50 Let Oktyabrya, Kirova streets and Kotulskogo Passway (Table 8). Since the main salts that determine the salt content are calcium and magnesium bicarbonates, at a hardness of less than 0.1mMol/L, the pH value from 8 to 9 is explained by the hydrolysis of these salts.
The meltwater from all samples is very soft: the hardness is less than 0.1mmol/L, this is explained by the freezing of the already soft water. Because in any water hardness ions (Ca+2, Mg+2) bind with anions (HCO3-), then in very soft water the alkalinity caused by these anions is less than the detection threshold and is conventionally assumed to be zero.
The total salinity of meltwater, depending on the place of sampling, is shown in Figure 11: 1. Distilled water; 2. 50 Let Oktyabrya (street); 3. 50 Let Oktyabrya (roadside); 4. Talnakhskaya (street, near NTEK); 5. Talnakhskaya, 10 (near Arbat shop); 6. Kirova (Lyceum No. 40); 7. Kirova, 5; 8. Komsomolskaya (street); 9. Komsomolskaya (roadside); 10. Kotulskogo 15 (street); 11. Kotulskogo, 5 (roadside); 12. Metalurgov Square (street), 13. Metalurgov Square (roadside).
It can be seen from the graph (Figure 4) that the total salt content in the samples taken on the roadside is slightly higher than in the samples taken near apartment buildings. The highest salt content was noted in the sample taken at the Metallurgov Square near the road and on the street. The same samples showed a hardness of 0.8mMol/L and alkalinity of 1.2mMol/L. This can be explained by the fact that a significant amount of freshly fallen snow fell into the sample, which corresponds in composition to natural water (Table 9).
Since the Tsentralny District of Norilsk is located in close proximity to the industrial enterprises of the metallurgical production and machine-building factories, it could be expected that the snow would be contaminated with heavy metal ions and sulphate ions. From Table 9 it can be seen that the pollution of the snow cover with heavy metal ions was not observed. In all samples, their content was less than the threshold of sensitivity of qualitative reactions, i.e. less than 0.1mg/L. The sulphate ion is formed from sulphur-containing gases under the influence of atmospheric oxygen and moisture contained in the air by the reaction (Eq. 10):
No sulphate ion was found in the samples under study. This may indicate that the sulphur-containing gases of metallurgical production practically did not get into the residential zone of the Tsentralny District of Norilsk.
This is confirmed by meteorological data (Appendix 1): in the period from October to April, the main wind direction is south, south-west or south-east, and metallurgical enterprises are located in the north-west of the urban area. Thus, the main contaminant of snow cover is solid slag particles, which are sprinkled on roads and sidewalks to improve vehicle traction and prevent pedestrian injury. Cars, when driving, throw off slag particles to the side of the road and thereby pollute the snow cover, the pollution of snow with solid particles depends on the number of vehicles passing along this section of the road. The dependence of the presence of solid particles in the meltwater on the number of cars passing through the road section per hour is shown in Figure 5.
Figure 2) Average daily temperature in Norilsk in March
Figure 3) Average daily temperature in Norilsk in April
Table 7) Organoleptic indicators
Table 8) Qualitative indicators of the state of the snow cover
Table 9) Content of non-ferrous metal ions and sulphate ion
Figure 4) Dependence of the total salt content on the sampling site
Figure 5) Dependence of solids content on the number of passing cars
Discussion
Scientists highlight the importance of snow-related studies and methods for converting snow depth to the water equivalent of snow [7-10, 14-25]. Nayak et al. [23] considered the problem of global warming, in particular, its impact on water resources and ecosystems in the context of the snowmelt process. Their research significantly impacts the decision-making process for reservoir and water management strategies. It states the necessity of complex investigations of global warming and climate-changing problems including the evaluation of the seasonal snow cover.
Bormann et al. [22] paid their attention to snow densification. Their method for predicting spring snow density from climate data was implemented in practice while the authors managed to calculate values related to snow density in the United States, Australia and the former Soviet :union:. While discussing the spatial snow distribution within the Berchtesgaden National Park area, Bernhardt et al. [25] substantiated the need to accurately predict snow distribution and analysed processes associated with snow redistribution and melt-water generation. This study allowed us to make conclusions regarding the specifics of runoff routing, probability and scales of possible floods. The researcher proved that their model should be implemented and analysed within other territorial areas [25]. Schöber et al. [24] developed a method for estimating snow bulk density that can be useful for fieldwork and hydrological and glaciological studies.
Chemically pure water which completely lacks taste and smell does not occur in nature. Soluble substances can change some properties of water including smell and taste. Sources of smell and taste can be of natural and artificial origin, including rotting plants, fungi and mould, bacteria, heavy metal compounds, industrial waste, chlorophenolic compounds, etc. [7, 12, 24]. Since these sources can negatively affect water quality, standards for its assessment have been developed [1, 3, 4].
Conclusion
The pH of the meltwater of the snow cover is close to neutral and is equal to 6.0-9.0. Salinity is caused by the presence of ions (Ca+2, Mg+2, HCO3-). Ions of heavy metals and sulphate ions were not detected in the melting snow, thus, no pollution with industrial gases in the residential area was noted. The main contamination with solid particles is due to the slagging of roads to improve the vehicle traction on the road surface.
Acknowledgements: There is nothing to be declared.
Ethical Permissions: There is nothing to be declared.
Conflicts of Interests: There is nothing to be declared.
Authors’ Contribution: Karmanovskaya N.V. (First Author), Introduction Writer/Main Researcher/Discussion Writer (34%); Nosova O.V. (Second Author), Assistant Researcher, Methodologist (33%); Kaverzin A.V. (Third Author), Statistical Analyst (33%).
Funding/Support: There is nothing to be declared.
Article Type: Original Research |
Subject:
Social Health
Received: 2021/09/29 | Accepted: 2021/11/16 | Published: 2022/01/29
Received: 2021/09/29 | Accepted: 2021/11/16 | Published: 2022/01/29
References
1. Кодекс. GOST R 57164-2016: Drinking water: Methods for the determination of odour, taste and turbidity. Кодекс; 2018. [cited 2021 July 15]. Available from: https://docs.cntd.ru/document/1200140391. [Russian] [Link]
2. Vasiliev VP. Analytical chemistry. Vasiliev VP. Titrimetric and gravimetric methods of analysis. Moscow: Drofa; 2005. [Russian] [Link]
3. Кодекс. GOST R 52407-2005: Drinking water: Methods for determining hardness. Кодекс; 2007 [cited 2021 July 15]. Available from: http://docs.cntd.ru/document/1200042882. [Russian] [Link]
4. Кодекс. GOST 31865-2012: Water: Stiffness unit. Кодекс; 2019 [cited 2021 July 15]. Available from: http://protect.gost.ru/document.aspx?control=7&id=181004. [Russian] [Link]
5. Kharitonov YuYa. Analytical chemistry. Moscow: Vysshaya Shkola; 2003. [Russian] [Link]
6. Zolotov YuYa. Fundamentals of analytical chemistry. Moscow: Vysshaya Shkola; 2001. [Russian] [Link]
7. Lebedev SV, Agafonova EK. Ecogeochemical estimation of environmental pollution by monitoring data of heavy metals contamination in soil and snow cover (at the example of Vasileostrovsky district of Saint Petersburg). Vestnik St Petersburg Univ Earth Sci. 2017;62(4):357-69. [Russian] [Link] [DOI:10.21638/11701/spbu07.2017.403]
8. Collados-Lara AJ, Pulido-Velazquez D, Pardo-Igúzquiza E, Alonso-González E. Estimation of the spatiotemporal dynamic of snow water equivalent at mountain range scale under data scarcity. Sci Total Env. 2020;741:140485. [Link] [DOI:10.1016/j.scitotenv.2020.140485] [PMID]
9. Kim Y, Kodama YB, Fochesatto GJ. Environmental factors regulating winter CO2 flux in snow-covered black forest soil of Interior Alaska. Geochem J. 2017;51(4):359-71. [Link] [DOI:10.2343/geochemj.2.0475]
10. Levshina S. Distribution and Characteristic of PAHs in snow of the Urban and reserve areas of southern far east Russia. Bull Environ Contam Toxicol. 2019;102(5):160-7. [Link] [DOI:10.1007/s00128-018-02533-6] [PMID]
11. Mortazavi R, Attiya S, Ariya PA. Diversity of metals and metal-interactive bacterial populations in different types of Arctic snow and frost flowers: Implications on snow freeze-melt processes in a changing climate. Sci Total Env. 2019;690:277-89. [Link] [DOI:10.1016/j.scitotenv.2019.06.350] [PMID]
12. Pashayan SA, Sindireva AV, Boev VA. Features of accumulation of trace elements in the soil-honey plants system in the Tyumen region. IOP Conf Ser Earth Env Sci. 2020;548:062044. [Link] [DOI:10.1088/1755-1315/548/6/062044]
13. Romasko VYu, Burakov DA. Monitoring of snow cover of river watersheds. CEUR Workshop Proceed. 2017;2033:220-4. [Russian] [Link]
14. Liu J, Zhang W, Liu T. Monitoring recent changes in snow cover in Central Asia using improved MODIS snow-cover products. J Arid Land. 2017;9:763-77. [Link] [DOI:10.1007/s40333-017-0103-6]
15. Fedonyuk L, Pryvrotska I, Rujytska O. Ecological features, distribution and epidemiological significance of family ixodidae ticks. Sci Horiz. 2019;11(84):121-9. [Link] [DOI:10.33249/2663-2144-2019-84-11-121-129]
16. Berlinets M. Environmental efficiency of post-harvest grain processing in combined photovoltaic / wind power systems. Sci Horiz. 2020;23(12):58-64. [Link] [DOI:10.48077/scihor.23(12).2020.58-64]
17. Küçük M, Findik F. Selected ecological settlements. Herit Sustain Dev. 2020;2(1):1-16. [Link] [DOI:10.37868/hsd.v2i1.35]
18. Ikanović M, Iseni M, Adilović M, Hromić-Jahjefendić A. The effect of active charcoal filter on viability of bacteria isolated from the tap water in Sarajevo. Herit Sustain Dev. 2020;2(2):100-7. [Link] [DOI:10.37868/hsd.v2i2.46]
19. Günes-Durak S. Investigation of microplastics removal methods from aquatic environments. Herit Sustain Dev. 2021;3(1):58-63. [Link] [DOI:10.37868/hsd.v3i1.56]
20. Bormann KJ, Westra S, Evans JP, McCabe MF. Spatial and temporal variability in seasonal snow density. J Hydrol. 2013;(484):63-73. [Link] [DOI:10.1016/j.jhydrol.2013.01.032]
21. Dai L, Che T, Wang J, Zhang P. Snow depth and snow water equivalent estimation from AMSR-E data based on a priori snow characteristics in Xinjiang, China. Remote Sens Environ. 2012;127:14-29. [Link] [DOI:10.1016/j.rse.2011.08.029]
22. Bormann KJ, McCabe MF, Evans JP. Satellite based observations for seasonal snow cover detection and characterisation in Australia. Remote Sens Environ. 2012;123:57-71. [Link] [DOI:10.1016/j.rse.2012.03.003]
23. Nayak A, Marks D, Chandler DG, Winstral A. Modeling interannual variability in snow-cover development and melt for a semiarid mountain catchment. J Hydrol Eng. 2011;17(1):74-84. [Link] [DOI:10.1061/(ASCE)HE.1943-5584.0000408]
24. Schöber J, Achleitner S, Bellinger J, Kirnbauer R, Schöberl F. Analysis and modelling of snow bulk density in the Tyrolean Alps. Hydrol Res. 2016;47(2):419-41. [Link] [DOI:10.2166/nh.2015.132]
25. Bernhardt M, Schulz K, Liston GE, Zängl G. The influence of lateral snow redistribution processes on snow melt and sublimation in alpine regions. J Hydrol. 2012;424-425:196-206. [Link] [DOI:10.1016/j.jhydrol.2012.01.001]
Send email to the article author
| Rights and permissions | |
 |
This work is licensed under a Creative Commons Attribution-NonCommercial 4.0 International License. |