


Volume 9, Issue 3 (2021)
Health Educ Health Promot 2021, 9(3): 177-184 |
Back to browse issues page

Download citation:
BibTeX | RIS | EndNote | Medlars | ProCite | Reference Manager | RefWorks
Send citation to:


BibTeX | RIS | EndNote | Medlars | ProCite | Reference Manager | RefWorks
Send citation to:
Baghi S, Ebrahimzadeh M, Hedayati N. Effective Factors on Eating Disorders Prevention Methods; Analysis of Food-Related Data on Twitter. Health Educ Health Promot 2021; 9 (3) :177-184
URL: http://hehp.modares.ac.ir/article-5-48792-en.html
URL: http://hehp.modares.ac.ir/article-5-48792-en.html
1- Department of Computer Science, Science and Research Branch, Islamic Azad University, Tehran, Iran
2- Information Technology Entrepreneurship, Faculty of Entrepreneurship, Tehran University, Tehran, Iran , mh.ebrahimzadeh@ut.ac.ir
3- Department of Computer Engineering, South Tehran Branch, Islamic Azad University, Tehran, Iran
2- Information Technology Entrepreneurship, Faculty of Entrepreneurship, Tehran University, Tehran, Iran , mh.ebrahimzadeh@ut.ac.ir
3- Department of Computer Engineering, South Tehran Branch, Islamic Azad University, Tehran, Iran
Keywords: Eating Disorders [MeSH], Prevention [MeSH], Data Mining [MeSH], Big Data [MeSH], Twitter [MeSH]
Full-Text [PDF 589 kb]
(887 Downloads)
| Abstract (HTML) (1381 Views)
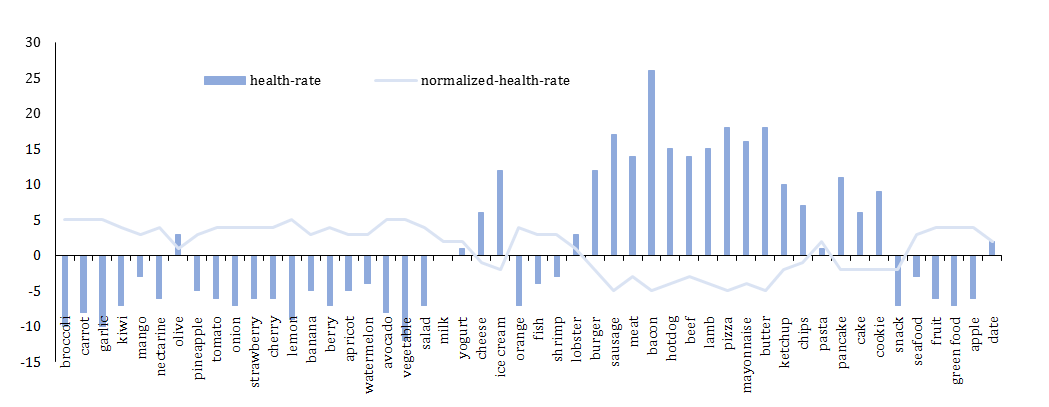
Diagram 1) Health-rate-values for food-related keywords from Table 1
Full-Text: (355 Views)
Introduction
Twitter is a very popular platform on social networks. According to the company's Twitter benchmarks, in 2017, more than 320 million users were actively used Twitter. As statistics show, Twitter users are increasing every year [1], and it makes much information on various topics in the hands of scientists making a great platform for researchers. According to Sinnenberg et al. [2], the number of Twitter-assisted studies has increased from 5 in 2010 to 40 in 2015. These statistics indicate that scientists in different fields of studies are aware of the importance of social media and big data analysis for their researches because they can access large amounts of data in real-time rather than collecting data from questionnaire forms or interview methods, however in some conditions, traditional information is not reliable and affordable. Nowadays, Twitter is widely used for public health issues due to presenting a large amount of data, having textual content useful for text mining analysis, and being popular worldwide [3].
Eating disorders directly affect human health and cause various health problems, including obesity, cancer, and heart disease. Identifying effective indicators and using them to find some ways to improve this type of behavior is very important. Governments have recently become aware of the importance of public health-related research and prevention; for instance, Washington State, USA, has spent more than 660 million dollars on prevention and community health division during 2017-19 [4]. Many indicators can be identified as factors influencing eating disorders in different people, including age, climate, access to healthy stores, education, gender, and income.
Various aspects of eating disorders have been investigated during several surveys using particular methods; for instance, climate change can be an effective factor in changing eating behavior. According to a study discussing the salient factors influencing eating behavior in adults [5], it is obvious that dietary options can also affect climate change for various reasons, such as the industrial process in food production and greenhouse gas emissions. In this survey, eating behavior has been shown to be a rolled result of factors such as physiology, environment, psychology, culture, socioeconomics, and genetics [6]. Considering Sloan's study [6], to indicate the effects of warm weather on eating disorders, college women were compared using a questionnaire on various factors (e.g., body mass index). The results demonstrated interesting ideas such as the influence of warm weather on generating some risks for eating disorders pathology. According to de Boer et al.'s study [7], eating less meat in diets can also significantly reduce the cost of climate change, especially in countries that use meat diets.
A survey in the United States using geolocated data from Twitter has illustrated that low access to healthy food and low income play an important role in eating disorders in people across the United States [8]. Other factors are also reported as salient factors of eating disorders. According to information about undergraduate and graduate students in various United States colleges and universities, Lipson and Sonneville have suggested weight or obesity as an influential factor rather than a gender factor in eating disorders [9]. On the other hand, Adeoye suggests gender and age as significant factors affecting Nigeria's eating habits [10, 11].
The main challenge of using big data instead of traditional statistical methods is how to analyze this large amount of big data. Sentiment analysis and social media use methods (especially its use in cross-sectional studies in various fields such as health, economics, politics, etc.) seem to be a rapidly developing principle. Twitter provides some useful information when trying to export information from Twitter APIs (Application Programming Interfaces) such as location and tweet text unless it has other useful information about age and gender. This excluded information can be predicted using the present information, such as tweet text. In research on predicting user attributes, Delip et al. have tried to find the gender, age, regional origin, and political orientation of the Twitter user through a tweet [12]. Some other studies have also focused on finding a valuable method to analyze the sentiment of different texts. Collomb et al. tried to classify and compare some sentiment analysis methods such as lexicon combinations and learning-based sentiment analysis approaches [13]. Research based on sentiment analysis includes Goyal's study [14], which announces a method of sentiment analysis using text mining and a hybrid classification approach on Twitter data, also defining methods using KNN (Key Nearest Neighbor), Naïve Bayes classifiers, and a hybrid classification.
Different platforms are available for textual context analysis, such as "The Stanford CoreNLP Natural Language Processing Toolkit" [15], which gives us a significant opportunity to use complex NLP (Natural Language Processing) models in researches, and these platforms and methods such as "recursive deep models for semantic compositionality over a sentiment treebank" [16] play different roles in various fields.
As a challenge to the use of present methods, the available methods are not designed for any specific field of study; hence, in some cases, according to the specific field of research, some additional information and improvement of methods are required. This study aimed to introduce a more accurate index for analyzing food-related data and making relations between people's opinions and the prevention treatments for eating disorders.
Instrument and Methods
More than 2 million eating-related tweets were collected using the Twitter Application Programming Interface (API) within 18 days (2017, 10 January to 2017, 8 February) through the various keywords in this data-mining study. Keywords were classified into some categories to utilize them to enhance the accuracy of the sentiment analysis process (Table 1).
Table 1) List of foods by category
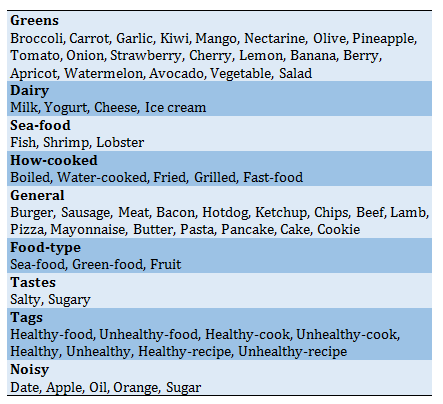
To predict each 1.5 million user's opinion about having a healthy or unhealthy diet, the overall sentiment score was calculated for each user by analyzing more than 2 million tweets. By selecting related tweets, each tweet text was analyzed to determine if it contains at least one of the keywords mentioned as output data or not. There was some other useful information (username, location, mentions, the number of followers, etc.). For example, location is a useful parameter for geolocation analysis but is not specified for all tweets and users, as there are sometimes restrictions on-location services. Hence, unstructured information is available to use and achieve the best results, so it is necessary to utilize the available information as correctly as possible. In terms of keywords classification, for instance, the "tags" cluster contains some words directly related to the research (e.g., healthy food) or, in the "noisy" cluster, words with a higher probability of being noisy were categorized (e.g., oil can also be related to petrochemicals). Tweets clustering was used to predict each tweet's value to verify the relationship between each tweet and the selected topic. Tweets with the higher predicted relationship rate were considered more influential samples in the results to increase the overall outcome accuracy. Users with spam tweets, tweets without enough information to make a valid prediction, and tweets with a predicted relation rate of zero were filtered and excluded.
Three main indicators (Basic-sentiment-rate; Health-rate, and Relation-rate) were used to predict if every user is more likely to have a healthy or unhealthy diet. Finally, these parameters were normalized, clustered, and combined to obtain an overall sentiment rate.
Basic-Sentiment-Rate (BSR): In research based on the comparison of sentiment analysis methods [13], three classifications were introduced as existing solutions for sentiment analysis, including machine learning methods, lexicon-based approach, and rule-based approach. According to Collomb et al.'s study [13], sentiment classification using lexical contextual sentence structure has an accuracy rate of 91% at the document level and 86% at the sentence level. Other methods are less accurate than the mentioned method, although the results are not precise and may differ according to the overall data. Considering the comparison of the mentioned article, it was decided to utilize lexical contextual sentence structure using a dictionary (a lexical resource explicitly devised to support the sentiment classification and opinion mining) and Pos-tagger application for opinion mining. In some previous studies, basic-sentiment-rate has been considered sufficient to identify an opinion about the user's thoughts. In contrast, this article tried to use the basic sentiment rate and the other indicators to achieve better accuracy in a specific field (eating disorders). Basic-sentiment-rate is a numerical value normalized between -5 and +5; rates mean negative opinions about the whole context of a tweet.
Health-Rate (HR): Each tweet in the database was contained at least one of the keywords in Table 1. Keywords were categorized as food's name in which were divided into healthy and unhealthy clusters. To have more precision in the result of the opinion, a score was calculated for each food using the nutrition profile used to control advertising in the UK [17]. Some parameters such as 1-energy, 2- saturated fat, 3- sugar, 4- sodium, 5- fiber, and 6- protein per 100 grams of each food were used to calculate the healthiness rate of each tweet containing at least one food-related keyword. Diagram 1 provides a list of health values for each food in Table 1; calculated scores for food-related tweets are between -10 and +26. According to a study by Lobstein & Davis [17], any food where it scores four or more points is classified as less healthy. In this article, most of Twitter's opinion has been noted to identify their opinions on a diet. For example, there are two users with different tweet texts, the first user is willing to have "bacon", and the second user is willing to have "pasta" for lunch. According to Diagram 1, "bacon" is much unhealthier than "pasta", so it can be understood that the first user is more interested in an unhealthy diet (at least in this tweet) than the second. Clustering and normalization of health rates were performed using a simple k-means method with Euclidean distance, as final health-rate normalized values (clusters) are between -5 and +5. According to the nutritional profile method of advertising controls in the UK, the mines rates generally illustrate unhealthy foods. Diagram 1 also demonstrates the normalized health-rate values for each related keyword. Besides, regarding some complex keywords (e.g., vegetables), health rate was calculated using average amounts of affective factors (e.g., fiber amount).
Twitter is a very popular platform on social networks. According to the company's Twitter benchmarks, in 2017, more than 320 million users were actively used Twitter. As statistics show, Twitter users are increasing every year [1], and it makes much information on various topics in the hands of scientists making a great platform for researchers. According to Sinnenberg et al. [2], the number of Twitter-assisted studies has increased from 5 in 2010 to 40 in 2015. These statistics indicate that scientists in different fields of studies are aware of the importance of social media and big data analysis for their researches because they can access large amounts of data in real-time rather than collecting data from questionnaire forms or interview methods, however in some conditions, traditional information is not reliable and affordable. Nowadays, Twitter is widely used for public health issues due to presenting a large amount of data, having textual content useful for text mining analysis, and being popular worldwide [3].
Eating disorders directly affect human health and cause various health problems, including obesity, cancer, and heart disease. Identifying effective indicators and using them to find some ways to improve this type of behavior is very important. Governments have recently become aware of the importance of public health-related research and prevention; for instance, Washington State, USA, has spent more than 660 million dollars on prevention and community health division during 2017-19 [4]. Many indicators can be identified as factors influencing eating disorders in different people, including age, climate, access to healthy stores, education, gender, and income.
Various aspects of eating disorders have been investigated during several surveys using particular methods; for instance, climate change can be an effective factor in changing eating behavior. According to a study discussing the salient factors influencing eating behavior in adults [5], it is obvious that dietary options can also affect climate change for various reasons, such as the industrial process in food production and greenhouse gas emissions. In this survey, eating behavior has been shown to be a rolled result of factors such as physiology, environment, psychology, culture, socioeconomics, and genetics [6]. Considering Sloan's study [6], to indicate the effects of warm weather on eating disorders, college women were compared using a questionnaire on various factors (e.g., body mass index). The results demonstrated interesting ideas such as the influence of warm weather on generating some risks for eating disorders pathology. According to de Boer et al.'s study [7], eating less meat in diets can also significantly reduce the cost of climate change, especially in countries that use meat diets.
A survey in the United States using geolocated data from Twitter has illustrated that low access to healthy food and low income play an important role in eating disorders in people across the United States [8]. Other factors are also reported as salient factors of eating disorders. According to information about undergraduate and graduate students in various United States colleges and universities, Lipson and Sonneville have suggested weight or obesity as an influential factor rather than a gender factor in eating disorders [9]. On the other hand, Adeoye suggests gender and age as significant factors affecting Nigeria's eating habits [10, 11].
The main challenge of using big data instead of traditional statistical methods is how to analyze this large amount of big data. Sentiment analysis and social media use methods (especially its use in cross-sectional studies in various fields such as health, economics, politics, etc.) seem to be a rapidly developing principle. Twitter provides some useful information when trying to export information from Twitter APIs (Application Programming Interfaces) such as location and tweet text unless it has other useful information about age and gender. This excluded information can be predicted using the present information, such as tweet text. In research on predicting user attributes, Delip et al. have tried to find the gender, age, regional origin, and political orientation of the Twitter user through a tweet [12]. Some other studies have also focused on finding a valuable method to analyze the sentiment of different texts. Collomb et al. tried to classify and compare some sentiment analysis methods such as lexicon combinations and learning-based sentiment analysis approaches [13]. Research based on sentiment analysis includes Goyal's study [14], which announces a method of sentiment analysis using text mining and a hybrid classification approach on Twitter data, also defining methods using KNN (Key Nearest Neighbor), Naïve Bayes classifiers, and a hybrid classification.
Different platforms are available for textual context analysis, such as "The Stanford CoreNLP Natural Language Processing Toolkit" [15], which gives us a significant opportunity to use complex NLP (Natural Language Processing) models in researches, and these platforms and methods such as "recursive deep models for semantic compositionality over a sentiment treebank" [16] play different roles in various fields.
As a challenge to the use of present methods, the available methods are not designed for any specific field of study; hence, in some cases, according to the specific field of research, some additional information and improvement of methods are required. This study aimed to introduce a more accurate index for analyzing food-related data and making relations between people's opinions and the prevention treatments for eating disorders.
Instrument and Methods
More than 2 million eating-related tweets were collected using the Twitter Application Programming Interface (API) within 18 days (2017, 10 January to 2017, 8 February) through the various keywords in this data-mining study. Keywords were classified into some categories to utilize them to enhance the accuracy of the sentiment analysis process (Table 1).
Table 1) List of foods by category
To predict each 1.5 million user's opinion about having a healthy or unhealthy diet, the overall sentiment score was calculated for each user by analyzing more than 2 million tweets. By selecting related tweets, each tweet text was analyzed to determine if it contains at least one of the keywords mentioned as output data or not. There was some other useful information (username, location, mentions, the number of followers, etc.). For example, location is a useful parameter for geolocation analysis but is not specified for all tweets and users, as there are sometimes restrictions on-location services. Hence, unstructured information is available to use and achieve the best results, so it is necessary to utilize the available information as correctly as possible. In terms of keywords classification, for instance, the "tags" cluster contains some words directly related to the research (e.g., healthy food) or, in the "noisy" cluster, words with a higher probability of being noisy were categorized (e.g., oil can also be related to petrochemicals). Tweets clustering was used to predict each tweet's value to verify the relationship between each tweet and the selected topic. Tweets with the higher predicted relationship rate were considered more influential samples in the results to increase the overall outcome accuracy. Users with spam tweets, tweets without enough information to make a valid prediction, and tweets with a predicted relation rate of zero were filtered and excluded.
Three main indicators (Basic-sentiment-rate; Health-rate, and Relation-rate) were used to predict if every user is more likely to have a healthy or unhealthy diet. Finally, these parameters were normalized, clustered, and combined to obtain an overall sentiment rate.
Basic-Sentiment-Rate (BSR): In research based on the comparison of sentiment analysis methods [13], three classifications were introduced as existing solutions for sentiment analysis, including machine learning methods, lexicon-based approach, and rule-based approach. According to Collomb et al.'s study [13], sentiment classification using lexical contextual sentence structure has an accuracy rate of 91% at the document level and 86% at the sentence level. Other methods are less accurate than the mentioned method, although the results are not precise and may differ according to the overall data. Considering the comparison of the mentioned article, it was decided to utilize lexical contextual sentence structure using a dictionary (a lexical resource explicitly devised to support the sentiment classification and opinion mining) and Pos-tagger application for opinion mining. In some previous studies, basic-sentiment-rate has been considered sufficient to identify an opinion about the user's thoughts. In contrast, this article tried to use the basic sentiment rate and the other indicators to achieve better accuracy in a specific field (eating disorders). Basic-sentiment-rate is a numerical value normalized between -5 and +5; rates mean negative opinions about the whole context of a tweet.
Health-Rate (HR): Each tweet in the database was contained at least one of the keywords in Table 1. Keywords were categorized as food's name in which were divided into healthy and unhealthy clusters. To have more precision in the result of the opinion, a score was calculated for each food using the nutrition profile used to control advertising in the UK [17]. Some parameters such as 1-energy, 2- saturated fat, 3- sugar, 4- sodium, 5- fiber, and 6- protein per 100 grams of each food were used to calculate the healthiness rate of each tweet containing at least one food-related keyword. Diagram 1 provides a list of health values for each food in Table 1; calculated scores for food-related tweets are between -10 and +26. According to a study by Lobstein & Davis [17], any food where it scores four or more points is classified as less healthy. In this article, most of Twitter's opinion has been noted to identify their opinions on a diet. For example, there are two users with different tweet texts, the first user is willing to have "bacon", and the second user is willing to have "pasta" for lunch. According to Diagram 1, "bacon" is much unhealthier than "pasta", so it can be understood that the first user is more interested in an unhealthy diet (at least in this tweet) than the second. Clustering and normalization of health rates were performed using a simple k-means method with Euclidean distance, as final health-rate normalized values (clusters) are between -5 and +5. According to the nutritional profile method of advertising controls in the UK, the mines rates generally illustrate unhealthy foods. Diagram 1 also demonstrates the normalized health-rate values for each related keyword. Besides, regarding some complex keywords (e.g., vegetables), health rate was calculated using average amounts of affective factors (e.g., fiber amount).
Diagram 1) Health-rate-values for food-related keywords from Table 1
Relation-rate (RR): One of the main challenges with general opinion mining on Twitter is related to each tweet's relation rate to a specific subject. In some conditions, a tweet text containing some keywords may not be related to the considered topic; for instance, tweets containing noisy classified keywords (e.g., apple) are usually not related to any fruit. People usually mean the apple brand when they use this keyword in their tweets. On the other hand, keywords in the tag's cluster are related to what a tweet is expected to do, the opinion mining, and influence. Relation-rate is a parameter that demonstrates the level of relationship to a topic. In this research, a relation rate was used to increase the accuracy of results.
A test set of more than 1500 random tweets has been manually estimated for the manual-relation-rate of each context to make a substrate for predicting the relation-rate for the remaining tweets; for instance, due to the test set, tweets containing keywords from the "greens" and "how-cooked" clusters are usually more likely to be related to eating disorders than the tweets containing keywords only from the "greens" category. To demonstrate the importance of the relation-rate by taking a quick look at manually rated relation-rates (test set), it can be indicated that 35% of tweets are less than 50% related to the topic, and less related tweets, called "noisy tweets", may seriously affect the final results.
To lessen the noise effect on the final results, a model was built using a Naïve Bayes method and the mentioned test set to predict remaining tweets (training set). The predicted relation rate in this research is considered as an integer number between 0 and 5. All selected prediction models (e.g., Naïve Bayes) were chosen in the research with the criterion of less error rate.
Naïve Bayes [18] is a well-known prediction method that is especially useful for nominal attributes rather than numeric ones; it also needs less available training data than other logistic regression methods. The basic method for classifying Naïve Bayes is as follows:
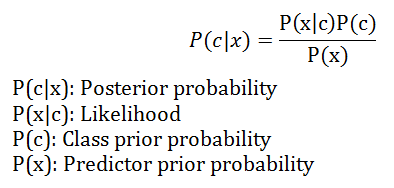
In this method, the previous method must be calculated for different scenarios and combined to make a prediction model. In this section, using the Naïve Bayes classification, we can achieve an accuracy of 78% in the evaluation made on the training set by cross-validation method and ten folds.
Final-sentiment-rate (FSR): Final-sentiment-rate is described as a final rate to identify what each user thinks about a healthy or unhealthy diet. The three mentioned parameters were used to calculate the final rate of the opinion mining process. In calculating the final sentiment rate, each parameter has the same weight as the others; for instance, if a tweet is predicted less related, it must have less effect on results than a tweet with a higher predicted relation rate. Final-sentiment-rate is calculated as follows, which is a number between -125 and +125:
FSR = HR×BSR×RR
This value is categorized into 5 clusters; so-good, good, neutral, bad, and so-bad. If HR is positive and BSR is positive, then FSR will definitely be positive. If HR is positive and BSR is negative, FSR is negative or unhealthy.
Findings
The overall sentiment score was calculated for 750566 users according to gender, location, and age. Location (387152 cases) and gender (194504 cases) attributes seem to be more valuable for analysis than age (3636 cases) attributes (Table 2).
Table 2) Count of available data for users with valid Final Sentiment Rate (FSR)
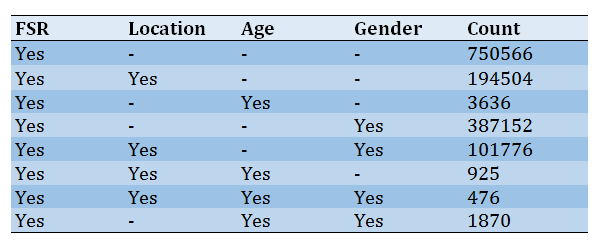
66% of tweets and 50% of users could be used for eating-disorders-related analysis using the introduced method of opinion mining (final-sentiment-rate).
Gender: According to the results related to gender, it can be indicated that gender attribute does not play an effective role in having a healthy or unhealthy diet alone. The mean score of sentiment was -0.17 in men and -0.14 in women. On the other hand, 47% of men and 46% of women were willing to have a healthy diet, and a kind of equality was visible when analyzing the database with gender attributes.
Location: Detecting location for a user can be gained using various ways. Some Twitter user-related data can directly provide location status, whereas another way to detect location is by time zone attribute. Eleven countries were selected considering the criteria of a higher repetition rate. Mexico and Spain showed the highest, and Venezuela showed the lower value of diet-related healthy thinking people (Diagram 2). According to results, it can be concluded that location can be more effective than gender when it is tried to identify effective indicators of people's dietary patterns. As a limitation, the number of tweets for each country is different in the database; hence, the results may change with a higher amount of location-related tweets; at least, location can be an effective indicator for people's dietary patterns.
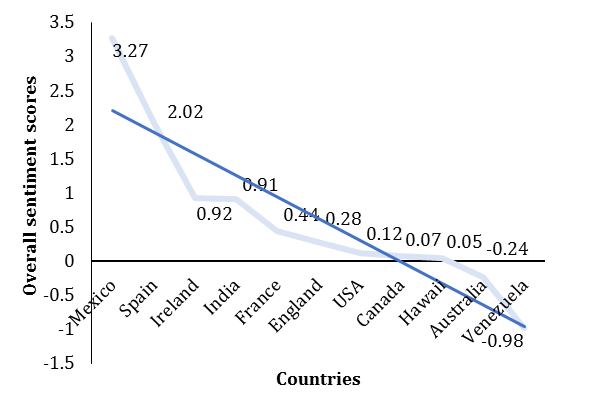
Diagram 2) Overall sentiment scores related to people's dietary patterns for 11 most repeated countries
Age: The valid number of users containing age status was not adequate to obtain a high confidence value (Table 2). A limited amount of age-related user data has been shown. People over the age of 30 years old seem to have a higher rate (overall point -11.59) of unhealthy diets than people under 30 years old (overall point -2.45).
Age+gender: Using age and gender attributes together may help you understand which gender is most likely to be at risk for eating disorders. There was no significant difference between men and women over the age of 30, whereas women under the age of 30 were more likely to have unhealthier diets than men under the age of 30.
Given this result, as mentioned earlier, an important limitation is the deficiency of age and gender-related tweets. This may generate less accuracy and less dependable results. User-count demonstrates the number of users with a valid combination of final sentiment rate, predicted gender, and predicted age (Diagram 3).
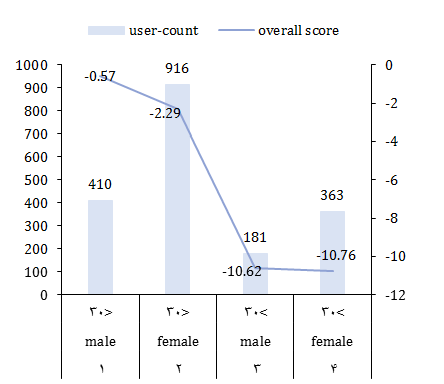
Diagram 3) Overall sentiment scores related to people's dietary patterns for users with age and gender prediction
Location+gender: Variation can be an attention point; Ireland and Venezuela, for example, showed approximately the same values between males and females, while Spain showed more variation between the two genders (Diagram 4).
As a limitation of this section, for different countries in the selected list, there were different counts of users with related tweets (user-count); thus, the results of some countries (e.g., USA) was more accurate due to a higher count of user-related tweets, while some countries provided fewer users with related tweets in the research's database (e.g., Venezuela). As additional supplementary research, tweets count can be increased for more accuracy and a better revision in the results, especially for some attributes.
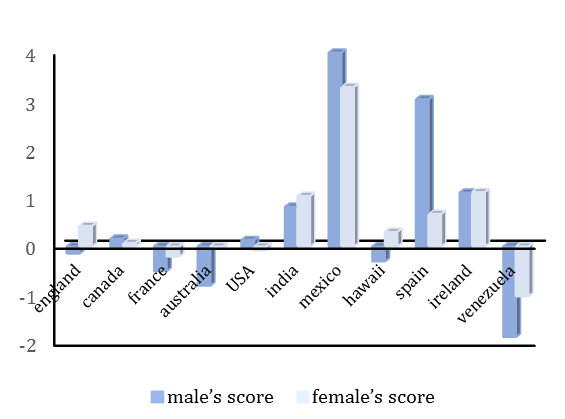
Diagram 4) Overall sentiment scores related to people's dietary patterns for users with location and gender prediction
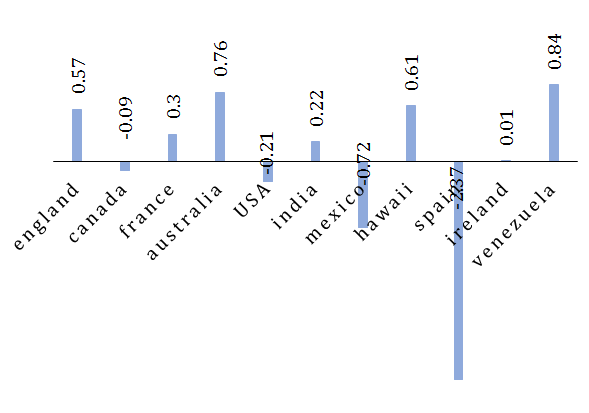
Diagram 5) Predicted reward or punishment category for countries
According to Diagram 3, gender scores can be used to decide on the weight of prevention methods related to eating disorders in different countries, and to achieve the best cut, subtraction between males and females points can also be used to give weight for the number of activities of an organization in a specific community such as country, state or city to balance the prevention activities. In Diagram 5, countries are classified using the present results in Diagram 3 to make a preferential prediction from the mentioned categories.
Discussion
One of the main goals of this study was to introduce a method to use big data to treat eating disorders; the FSR index was introduced. There are different methods to obtain a number to count clusters of FSR; for example, five clusters were used for relation-rate in this research. In a study carried out by Milligan and Cooper [19], some methods for finding the best number for clusters were reviewed, whereas there is no definite way to obtain the best number of clusters because finding the best cut can be data-related, and it remains as a challenge in data science studies; hence, in this article for simplification, it has decided to use five clusters. As a challenging point in this article, "finding the best cut for clusters" can be optimized in future researches.
As briefly discussed earlier, eating disorders can directly or indirectly cause health problems, such as obesity, cancer, and even climate change. Nowadays, controlling eating disorders has made an important challenge for scientists. Eating disorder prevention methods can be applied to governments and health organizations, such as holding healthy food festivals or other educational methods. Eating disorders can be prevented in two main ways; punishment and reward. Health organizations can provide various opportunities to encourage people to follow healthy diets or indirect punishments for eating disorders, such as rising prices for unhealthy foods. The decision to choose a category can be made according to what the community needs more. Based on a study on the effect of punishment and reward on men and women, one way to select a category is to consider gender-related data [20]. Sensitivity to punishment is more in women, while sensitivity to reward is higher in men.
As mentioned earlier, Twitter does not provide all the user information while trying to get information from its APIs; hence, a study [12] has tried to introduce prediction methods for some attributes. To predict the age and gender attributes of users, some methods of the mentioned research were used. For instance, to predict the gender of a tweeter user, some expressions (e.g., emoticons and character repetition) were analyzed using rates related to these expressions. User gender was classified as male or female. Like gender, age can also provide useful information in further sections of research. This article tried to find out users' age using the introduced methods, such as finding the related keywords (e.g., my internship) to identify whether they are above or below 30 years old. Keywords were detected experimentally in some analyzed models in this research. Extracted results were too limited for age and gender attributes because these
methods could be applied for some tweets and users; hence, to predict gender, in addition to the mentioned method, the top 1000 more repeated names were genderized (using usernames) to create a larger available information scale for gender. The age attribute does not provide much information, so it can be considered a limitation in obtaining accurate results.
To balance the eating disorders prevention methods in a community, gender attributes can be used to select the most effective category (punishment or reward). For example, according to this study, men can reach a better point among selected users from Spain than women. Hence, women can be a point of interest for the prevention activities of eating disorders. Therefore, punishment-related methods and activities can have a priority over reward-related methods and activities.
A limitation of this study is obvious in tweets containing latitude and longitude properties. English-speaking users' tweets are not evenly distributed worldwide, so when the results are analyzed without considering the location parameter, some countries are much more influential than others to mislead the global results. Even when a particular country is under the magnifier, it may be discovered some hidden facts. There is a lack of normal distribution in the United States; even when the language is English across the country, the country's eastern side shows more density than the western side. This may cause some result deviations even if a location is included as a parameter in the research.
It is highly recommended to increase the count of tweets and improve the results using the methods introduced in this research. As a disadvantage of the mentioned methods, the filtered tweets ready for analysis are few compared to the whole dataset, but the results can be more accurate as an advantage of the methods. The count of data can be easily increased because millions of tweets are available for analysis, but the accuracy of the methods has a higher priority in this research; therefore, increasing the data volume can improve the disadvantage of the methods.
Conclusion
Punishment/reward combination criteria that are predicted with both gender and location data by FSR index is the most effective factor in making the relationship between peoples' opinion and prevention treatments for eating disorders.
Acknowledgments: Nothing was reported.
Ethical Permissions: Nothing was reported.
Conflicts of Interests: Nothing was reported.
Authors' Contribution: Baghi S. (First Author), Original Researcher/Methodologist (50%); Ebrahimzadeh M.H. (Second Author), Introduction author/Discussion author (30%); Hedayati N. (Third Author), Statistical analyst (20%).
Funding/Sources: This study was not funded by any organization.
A test set of more than 1500 random tweets has been manually estimated for the manual-relation-rate of each context to make a substrate for predicting the relation-rate for the remaining tweets; for instance, due to the test set, tweets containing keywords from the "greens" and "how-cooked" clusters are usually more likely to be related to eating disorders than the tweets containing keywords only from the "greens" category. To demonstrate the importance of the relation-rate by taking a quick look at manually rated relation-rates (test set), it can be indicated that 35% of tweets are less than 50% related to the topic, and less related tweets, called "noisy tweets", may seriously affect the final results.
To lessen the noise effect on the final results, a model was built using a Naïve Bayes method and the mentioned test set to predict remaining tweets (training set). The predicted relation rate in this research is considered as an integer number between 0 and 5. All selected prediction models (e.g., Naïve Bayes) were chosen in the research with the criterion of less error rate.
Naïve Bayes [18] is a well-known prediction method that is especially useful for nominal attributes rather than numeric ones; it also needs less available training data than other logistic regression methods. The basic method for classifying Naïve Bayes is as follows:
In this method, the previous method must be calculated for different scenarios and combined to make a prediction model. In this section, using the Naïve Bayes classification, we can achieve an accuracy of 78% in the evaluation made on the training set by cross-validation method and ten folds.
Final-sentiment-rate (FSR): Final-sentiment-rate is described as a final rate to identify what each user thinks about a healthy or unhealthy diet. The three mentioned parameters were used to calculate the final rate of the opinion mining process. In calculating the final sentiment rate, each parameter has the same weight as the others; for instance, if a tweet is predicted less related, it must have less effect on results than a tweet with a higher predicted relation rate. Final-sentiment-rate is calculated as follows, which is a number between -125 and +125:
FSR = HR×BSR×RR
This value is categorized into 5 clusters; so-good, good, neutral, bad, and so-bad. If HR is positive and BSR is positive, then FSR will definitely be positive. If HR is positive and BSR is negative, FSR is negative or unhealthy.
Findings
The overall sentiment score was calculated for 750566 users according to gender, location, and age. Location (387152 cases) and gender (194504 cases) attributes seem to be more valuable for analysis than age (3636 cases) attributes (Table 2).
Table 2) Count of available data for users with valid Final Sentiment Rate (FSR)
66% of tweets and 50% of users could be used for eating-disorders-related analysis using the introduced method of opinion mining (final-sentiment-rate).
Gender: According to the results related to gender, it can be indicated that gender attribute does not play an effective role in having a healthy or unhealthy diet alone. The mean score of sentiment was -0.17 in men and -0.14 in women. On the other hand, 47% of men and 46% of women were willing to have a healthy diet, and a kind of equality was visible when analyzing the database with gender attributes.
Location: Detecting location for a user can be gained using various ways. Some Twitter user-related data can directly provide location status, whereas another way to detect location is by time zone attribute. Eleven countries were selected considering the criteria of a higher repetition rate. Mexico and Spain showed the highest, and Venezuela showed the lower value of diet-related healthy thinking people (Diagram 2). According to results, it can be concluded that location can be more effective than gender when it is tried to identify effective indicators of people's dietary patterns. As a limitation, the number of tweets for each country is different in the database; hence, the results may change with a higher amount of location-related tweets; at least, location can be an effective indicator for people's dietary patterns.
Diagram 2) Overall sentiment scores related to people's dietary patterns for 11 most repeated countries
Age: The valid number of users containing age status was not adequate to obtain a high confidence value (Table 2). A limited amount of age-related user data has been shown. People over the age of 30 years old seem to have a higher rate (overall point -11.59) of unhealthy diets than people under 30 years old (overall point -2.45).
Age+gender: Using age and gender attributes together may help you understand which gender is most likely to be at risk for eating disorders. There was no significant difference between men and women over the age of 30, whereas women under the age of 30 were more likely to have unhealthier diets than men under the age of 30.
Given this result, as mentioned earlier, an important limitation is the deficiency of age and gender-related tweets. This may generate less accuracy and less dependable results. User-count demonstrates the number of users with a valid combination of final sentiment rate, predicted gender, and predicted age (Diagram 3).
Diagram 3) Overall sentiment scores related to people's dietary patterns for users with age and gender prediction
Location+gender: Variation can be an attention point; Ireland and Venezuela, for example, showed approximately the same values between males and females, while Spain showed more variation between the two genders (Diagram 4).
As a limitation of this section, for different countries in the selected list, there were different counts of users with related tweets (user-count); thus, the results of some countries (e.g., USA) was more accurate due to a higher count of user-related tweets, while some countries provided fewer users with related tweets in the research's database (e.g., Venezuela). As additional supplementary research, tweets count can be increased for more accuracy and a better revision in the results, especially for some attributes.
Diagram 4) Overall sentiment scores related to people's dietary patterns for users with location and gender prediction
Diagram 5) Predicted reward or punishment category for countries
According to Diagram 3, gender scores can be used to decide on the weight of prevention methods related to eating disorders in different countries, and to achieve the best cut, subtraction between males and females points can also be used to give weight for the number of activities of an organization in a specific community such as country, state or city to balance the prevention activities. In Diagram 5, countries are classified using the present results in Diagram 3 to make a preferential prediction from the mentioned categories.
Discussion
One of the main goals of this study was to introduce a method to use big data to treat eating disorders; the FSR index was introduced. There are different methods to obtain a number to count clusters of FSR; for example, five clusters were used for relation-rate in this research. In a study carried out by Milligan and Cooper [19], some methods for finding the best number for clusters were reviewed, whereas there is no definite way to obtain the best number of clusters because finding the best cut can be data-related, and it remains as a challenge in data science studies; hence, in this article for simplification, it has decided to use five clusters. As a challenging point in this article, "finding the best cut for clusters" can be optimized in future researches.
As briefly discussed earlier, eating disorders can directly or indirectly cause health problems, such as obesity, cancer, and even climate change. Nowadays, controlling eating disorders has made an important challenge for scientists. Eating disorder prevention methods can be applied to governments and health organizations, such as holding healthy food festivals or other educational methods. Eating disorders can be prevented in two main ways; punishment and reward. Health organizations can provide various opportunities to encourage people to follow healthy diets or indirect punishments for eating disorders, such as rising prices for unhealthy foods. The decision to choose a category can be made according to what the community needs more. Based on a study on the effect of punishment and reward on men and women, one way to select a category is to consider gender-related data [20]. Sensitivity to punishment is more in women, while sensitivity to reward is higher in men.
As mentioned earlier, Twitter does not provide all the user information while trying to get information from its APIs; hence, a study [12] has tried to introduce prediction methods for some attributes. To predict the age and gender attributes of users, some methods of the mentioned research were used. For instance, to predict the gender of a tweeter user, some expressions (e.g., emoticons and character repetition) were analyzed using rates related to these expressions. User gender was classified as male or female. Like gender, age can also provide useful information in further sections of research. This article tried to find out users' age using the introduced methods, such as finding the related keywords (e.g., my internship) to identify whether they are above or below 30 years old. Keywords were detected experimentally in some analyzed models in this research. Extracted results were too limited for age and gender attributes because these
methods could be applied for some tweets and users; hence, to predict gender, in addition to the mentioned method, the top 1000 more repeated names were genderized (using usernames) to create a larger available information scale for gender. The age attribute does not provide much information, so it can be considered a limitation in obtaining accurate results.
To balance the eating disorders prevention methods in a community, gender attributes can be used to select the most effective category (punishment or reward). For example, according to this study, men can reach a better point among selected users from Spain than women. Hence, women can be a point of interest for the prevention activities of eating disorders. Therefore, punishment-related methods and activities can have a priority over reward-related methods and activities.
A limitation of this study is obvious in tweets containing latitude and longitude properties. English-speaking users' tweets are not evenly distributed worldwide, so when the results are analyzed without considering the location parameter, some countries are much more influential than others to mislead the global results. Even when a particular country is under the magnifier, it may be discovered some hidden facts. There is a lack of normal distribution in the United States; even when the language is English across the country, the country's eastern side shows more density than the western side. This may cause some result deviations even if a location is included as a parameter in the research.
It is highly recommended to increase the count of tweets and improve the results using the methods introduced in this research. As a disadvantage of the mentioned methods, the filtered tweets ready for analysis are few compared to the whole dataset, but the results can be more accurate as an advantage of the methods. The count of data can be easily increased because millions of tweets are available for analysis, but the accuracy of the methods has a higher priority in this research; therefore, increasing the data volume can improve the disadvantage of the methods.
Conclusion
Punishment/reward combination criteria that are predicted with both gender and location data by FSR index is the most effective factor in making the relationship between peoples' opinion and prevention treatments for eating disorders.
Acknowledgments: Nothing was reported.
Ethical Permissions: Nothing was reported.
Conflicts of Interests: Nothing was reported.
Authors' Contribution: Baghi S. (First Author), Original Researcher/Methodologist (50%); Ebrahimzadeh M.H. (Second Author), Introduction author/Discussion author (30%); Hedayati N. (Third Author), Statistical analyst (20%).
Funding/Sources: This study was not funded by any organization.
Article Type: Descriptive & Survey |
Subject:
Health Media
Received: 2020/12/30 | Accepted: 2021/03/7 | Published: 2021/07/24
Received: 2020/12/30 | Accepted: 2021/03/7 | Published: 2021/07/24
References
1. Twitter. Selected company metrics and financials [Internet]. New York: Twitter; 2018 [cited 2020 Dec 13]. Available from: https://www.marketscreener.com/quote/stock/TWITTER-38965267/news/Twitter-Selected-Company-Metrics-and-Financials--31818921/ [Link]
2. Sinnenberg L, Buttenheim AM, Padrez K, Mancheno Ch, Ungar L, Merchant RM. Twitter as a tool for health research: A systematic review. Am J Pub Health. 2017;107(1):e1-8. [Link] [DOI:10.2105/AJPH.2016.303512] [PMID] [PMCID]
3. Paul JM, Dredze M. You are what you tweet: Analyzing twitter for public health. Artif Intell. 2011;38:265-72. [Link]
4. Washington Health Care Authority. Budget Information (2017-2019) [Internet]. Washington: Washington Health Care Authority; 2020 [cited 2020 13 December]. Available from: https://www.hca.wa.gov/about-hca/budget-information. [Link]
5. Emilien C, Hollis JH. A brief review of salient factors influencing adult eating behaviour. Nutr Res Rev. 2017;30(2):233-46. [Link] [DOI:10.1017/S0954422417000099] [PMID]
6. Sloan DM. Does warm weather climate affect eating disorder pathology?. Int J Eat Disord. 2002;32(2):240-4. [Link] [DOI:10.1002/eat.10077] [PMID]
7. De Boer J, de Wittb A, Aikinga H. Help the climate, change your diet: A cross-sectional study on how to involve consumers in a transition to a low-carbon society. Appetite. 2016;98:19-27. [Link] [DOI:10.1016/j.appet.2015.12.001] [PMID]
8. Widener MJ, Li W. Using geolocated Twitter data to monitor the prevalence of healthy and unhealthy food references across the US. Appl Geogr. 2014;54:189-97. [Link] [DOI:10.1016/j.apgeog.2014.07.017]
9. Lipson Sk, Sonneville KR. Eating disorder symptoms among undergraduate and graduate students at 12 U.S. colleges and universities. Eat Behav. 2017;24:81-8. [Link] [DOI:10.1016/j.eatbeh.2016.12.003] [PMID]
10. Adeoye OA, Adeoye B. Gender, age and religion as determinants of eating habit of youth in ikenne local government of Ogun state, Nigeria. Edo J Couns. 2010;2(1):110-18. [Link] [DOI:10.4314/ejc.v2i1.52660]
11. Maruti Rongte S, Sengupta R. Assessment of the dietary patterns among school going children with age-group (9 years -15 years)-a gender comparison. Indian J Appl Res. 2015;5(5):19-21. [Link]
12. Rao D, Yarowsky D, Shreevats A, Gupta M. Classifying latent user attributes in Twitter. Proceedings of the 2nd international workshop on search and mining user-generated contents; 2010, 4 October. Toronto: ACM Digital Library; 2010. [Link] [DOI:10.1145/1871985.1871993]
13. Collomb A, Brunie L, Costea C. A study and comparison of sentiment analysis methods for reputation evaluation. Unknown proceeding. Unknown city: LIRIS; 2013. [Link]
14. Goyal S. Sentimental analysis of Twitter data using text mining and hybrid classification approach. Int J Adv Res Ideas Innov Technol. 2016;2(5):1-9. [Link]
15. Manning SD, Surdeanu M, Bauer J, Finkel J, Bethard SJ, McClosky D. The Stanford CoreNLP natural language processing toolkit. Proceedings of 52nd Annual Meeting of the Association for Computational Linguistics: System Demonstrations; 2014 June; Baltimore, Maryland. Pennsylvania: Association for Computational Linguistics; 2014. [Link] [DOI:10.3115/v1/P14-5010]
16. Socher R, Perelygin A, Wu J, Chuang J, Manning ChD, Ng A, et al. Recursive deep models for semantic compositionality over a sentiment treebank. Conference on empirical methods in natural language processing; 2013 Oct; Seattle, Washington, USA. Pennsylvania: Association for Computational Linguistics; 2013. [Link]
17. Lobstein T, Davies S. Defining and labelling 'healthy' and 'unhealthy' food. Public Health Nutr. 2009;12(3):331-40. [Link]
18. Lewis DD. Naive (Bayes) at forty: The independence assumption in information retrieval. In: Nédellec C, Rouveirol C, editors. Machine learning: ECML-98. ECML 1998. Lecture notes in computer science (Lecture notes in artificial intelligence). Volume 1398. Heidelberg: Springer; 1998. [Link] [DOI:10.1007/BFb0026666]
19. Milligan GW, Cooper MC. An examination of procedures for determining the number of clusters in a data set. Psychometrika. 1985;50:159-79. [Link] [DOI:10.1007/BF02294245]
20. Eneva KT, Murray S, O'Garro-Moore J, Yiu A, Alloy LB, Avena NM, et al. Reward and punishment sensitivity and disordered eating behaviors in men and women. J Eat Disord. 2017;5:6. [Link] [DOI:10.1186/s40337-017-0138-2] [PMID] [PMCID]
Send email to the article author
| Rights and permissions | |
 |
This work is licensed under a Creative Commons Attribution-NonCommercial 4.0 International License. |